Talk:20.109(S12):Aptamer binding assay (Day7)
From Course Wiki
Binding Data Files
| Group | T/R zip data file | W/F zip data file |
|---|---|---|
| Red | Media:S12-M1-TR_Red.csv | Media:S12-M1-WF_Red.csv |
| Orange | Media:S12-M1-TR_Orange.csv | Media:S12-M1-WF_Orange.csv |
| Yellow | Media:S12-M1-TR_Yellow.csv | Media:S12-M1-WF_Yellow.csv |
| Green | Media:S12-M1-TR_Green.csv | Media:S12-M1-WF_Green.csv |
| Blue | Media:S12-M1-TR_Blue.csv | Media:S12-M1-WF_Blue.csv |
| Pink | Media:S12-M1-TR_Pink.csv | Media:S12-M1-WF_Pink.csv |
| Purple | Media:S12-M1-TR_Purple.csv | Media:S12-M1-WF_Purple.csv |
Binding Data Results Summary
T/R
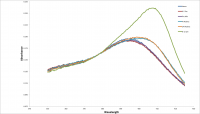
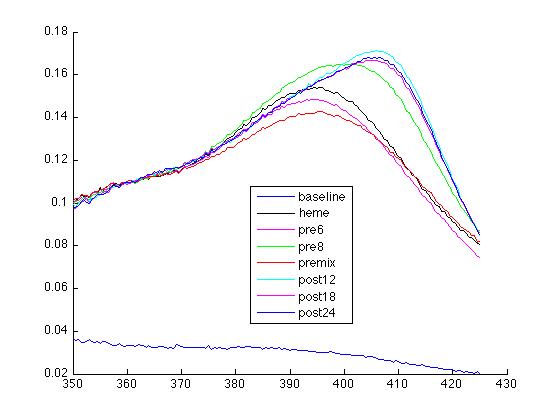
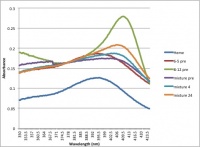
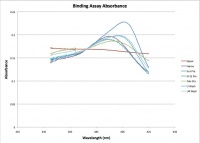
* Be sure to post the values you got after baseline correction, not the raw data (if your curves didn't line up)!
* Order: heme, 6-5, 8-12, "pre" mix, post low wash, post high wash
* Recommended syntax for A405 column: "#1 ; #2; #3 <br> #4; #5; #6"
| Group | Corrected A405 values* | Pre % 8-12: expected, measured | Post % 8-12: fewer washes, more washes (measured) | Additional comments | |
|---|---|---|---|---|---|
| Syntax sample | 0.1; 0.2; 0.3 0.4; 0.5; 0.6 |
10%, 12% | 40%, 50% (4, 24 washes) | We used Grey group's 6-5 because we didn't have any. | |
| Pink | 0.14025053 (heme) 0.1422987 (6-5 pre) 0.21195409 (8-12 pre) 0.13888393 (mix pre) 0.16228816 (4 wash) 0.17831185 (24 wash) |
0.5%, -0.049% | 28.70% (4 wash), 51.70% (24 wash) | We started with a 0.5% 8-12 mixture and washed with 4 and 24 washes to measure enrichment | |
| Orange | 0.034495637(heme) 0.03498132(pre6-5) 0.045843026(pre8-12) 0.03623888(pre-mix) 0.041412034 (4 Wash) 0.040929238(24 Wash) |
1%, 11.5% | 59.2% (4 Washes), 54.7% (24 Washes) | We started with a 1% 8-12 mixture and washed with 4 and 24 washes to measure enrichment. We also generated very little RNA (~.3nmol), and thus had to dilute everything down to this amount. |
|
| Yellow | 0.155;0.160212;0.2070; 0.1642;0.1768;0.1776 |
0.25%, 8.6% | 35%, 37%(4 and 24 washes) | We started with 0.25% 8-12 mixture and washed with 4 and 24 washes | |
| Red | 0.218110 (heme) 0.211707 (6-5 pre) 0.277449 (8-12 pre) 0.215079 (mix pre) 0.237636 (4 wash) 0.256438 (24 wash) |
2% (expected) 5.13% (measured) |
39.44% (4 washes) 62.91% (24 washes) |
Started with 2% 8-12 mixture and washed with 4 and 24 washes. | |
| Green | 0.182316407(heme) 0.174965575(6-5 pre) 0.257898369(8-12 pre) 0.178721126 (mix pre) 0.185683139 (8 wash) 0.192153301(36 wash) |
1% (expected),4.52 %(measured) | 12.92, 20.72 % (8 and 36 washes) | Started with 1% 8-12 mixture and washed with 8 and 36 washes. | |
| Purple | 0.084126; 0.085602645; 0.13737727; 0.09304013; 0.14838624; 0.12533093 |
10% (expected), 14.37% (measured) | 121.1 % (4 washes), 76.7% (24 washes) | Started with 10% 8-12 mixture and washed with 4 and 24 washes. | |
| Blue | 0.0415141 (heme) 0.040754 (6-5 pre) 0.068389 (8-12 pre) 0.05368(mix pre) 0.066094(10 wash) 0.067595 (30 wash) |
10% (expected), 46.77% (measured) | 91.69% (10 washes), 97.13% (30 washes) | Started with 10% 8-12 mixture and washed with 10 and 30 washes. | |
W/F
* Be sure to post the values you got after baseline correction, not the raw data (if your curves didn't line up)!
* Order: heme, 6-5, 8-12, "pre" mix, post low wash, post high wash
* Recommended syntax for A405 column: "#1 ; #2; #3 <br> #4; #5; #6"

