Spring 11:Chemotaxis Assay
By: Emmanuel Quiroz
Contents
Introduction
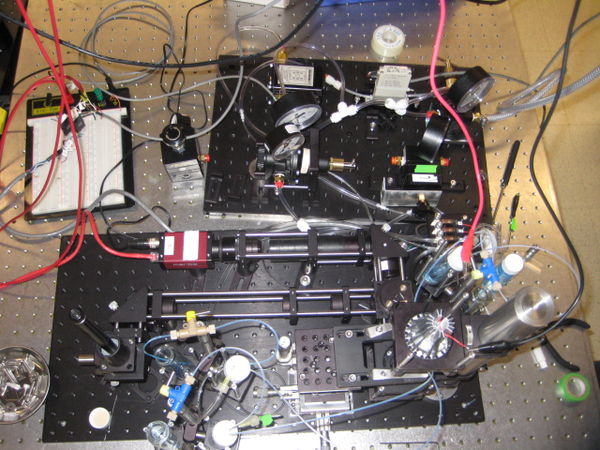
For my project I designed and developed an automated microfluidic system using Seymour et al’s microinjector microfluidic device to provide a high through-put method of acquiring bacterial chemotaxis parameters. The microinjector device was chosen for its simple design, diverse application to both fluid-flow and flow-free approaches, and for its ability to measure individual cell kinetics. The development of a faster and systematic device is especially useful in the research of marine microbes’ response to settling dissolved organic matter.
Objective
Further develop Stocker’s microfluidic system that will allow researchers to run chemotaxis assays more efficiently for high though-put assays. The main improvement to Stocker's system will be the use of pneumatic pressures instead of syringe fluid pressures to control fluid flow to set up the chemoatractant and microorganism bands. The pneumatic pressure will be computer controlled to to allow precise and reproducible experiments as well as increased experimental throughput.
Spring 20.345 Project Assignments
Readings and Resources
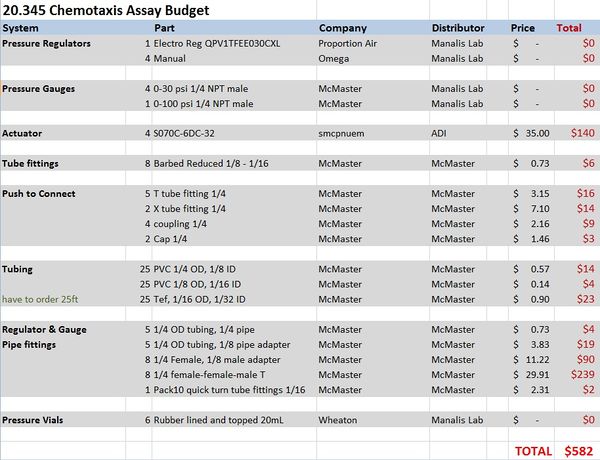
Materials and budget
- DAQ card NI-USB 6212
- Microinjector Microfluidic device from Stocker lab
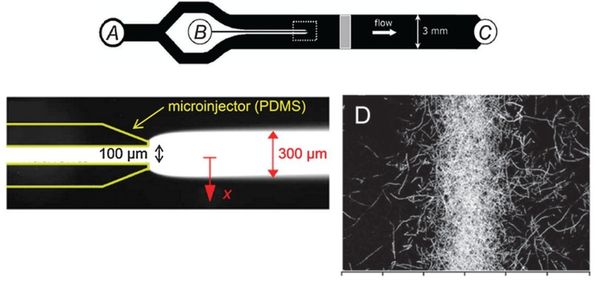
Microinjector Microfluidic Device
Flow-free, or ‘stopped-flow’, chemotaxis assays allow for the analysis of individual bacterial movement in the absence of shear forces and relies on natural diffusion to generate a gradient. In this approach, fluid flow is only used to set up an initial gradient, but is stopped, allowing the gradient to evolve by diffusion alone. These devices produce unsteady gradients that are advantageous in representing environmental conditions of nutrients especially in marine bacteria and in characterizing bacterial responses to wide range of concentration and gradients within a single experiement. The bacterial distribution is measured by recording the kinetic paths of individual bacteria using videomicroscopy. An example of this approach is Seymour et al’s microinjector microfluidic device
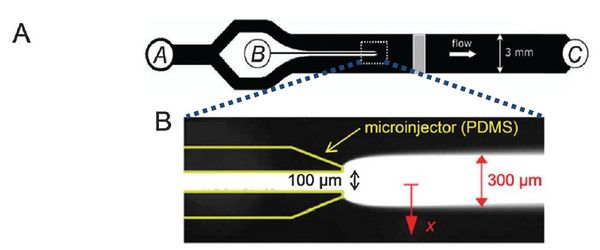
Dimmension
- Microinjector Channel
- width: 100μm
- depth: 50μm
- length:
- Cross Sect Area: 5e-9 m^2
- Main Channel
- width: 3mm
- depth: 50μm
- length: 45mm long
- Cross Sect Area: 0.15e-6 m^2
Microscope
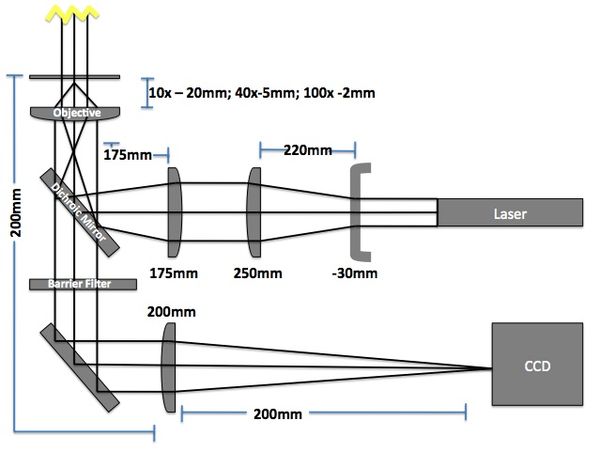
The imaging microscope will be a brightfield and fluorescent microscope as shown in Fig 3. A CCD camera will acquire images at a given rate and the kinetic paths will be tracked using particle tracking algorithms.
- Camera (Allied Manta G032B): 7.4μm sqr pixels, 656 x 492 pixels
- Field of View: 484μm x 366μm (10x objective w/200mm lens => 10x magnification)
- Red LED illumination
Pneumatic System Design
The pneumatic system is composed of manual and electro forward pressure regulators, solenoid actuators, pneumatic tubing, and circuitry to control regulators and solenoid actuators.
Basic Design
The fundamental principle behind this system is that changes in pressures causes fluid flow and when the pressure equalize to the same 'ground' pressure, fluid flow should stop. By this approach one is able to easily control fluid flow of the entire channel and the flow rates into inlets A and B to control the width of the chemoeffector band, dependent on the ratio of $ P_{A} $ and $ P_{B} $. Solenoid actuators, controlled by LabView, to switch from the 'flow' pressure state to the 'stopped' state as shown in the figure below.
Solenoid Actuators
SMC S070C-6DC-32(File:S070 Actuator SMC.pdf)
- needs Power of .5W (12V-DC, 0.04 Amps)
- Solenoid impedance of ~300 Ohm
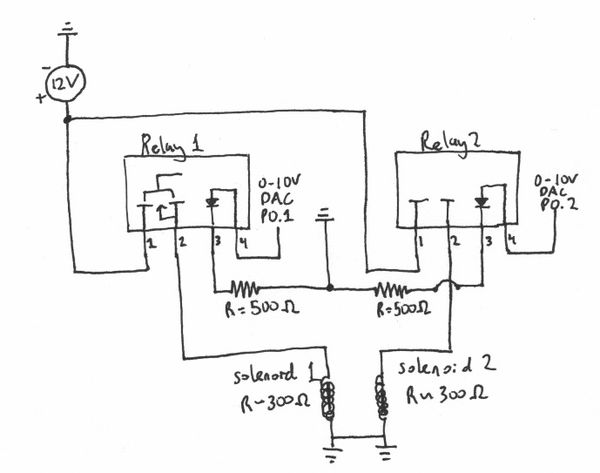
- DAQ unable to reach this Power output for solenoid actuators so need to use Relay circuit as shown in the figure below.
- Note: Used 500 Ohm resistor to ground to avoid putting a large load on the DAQ
Power Relay Specs
Clare CPC1709J Power Relay
- Ports
- (+) 12 V (Voltage output to solenoid)
- (-) out
- (-) ground
- (+) DAQ-VDC (trigger)
Electro Pressure Regulator
Proportion Air QPV1TFEE030CXL (File:QPV1 Electro Reg.pdf)
- 15-24 V, 0.1 - 0.35 Amps
Circuit Element Design
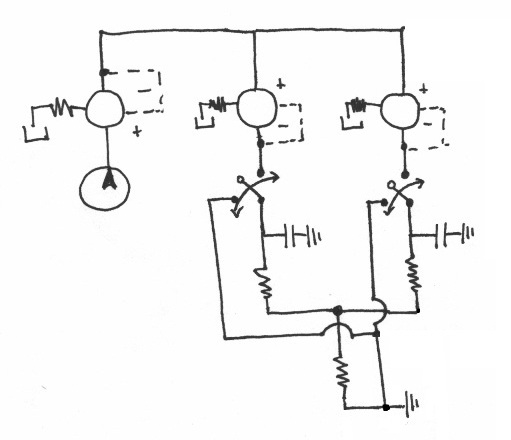
In order to understand the system, I modeled it as a lumped circuit elements model (Interdisciplinary Electrical Analogies). All of the pressure potentials are measured relative to atmospheric (atm = 0 psi). The pressurized wheaton vials act as capacitors. Fluid resistance depends on pressure drop and inversely to fluid flow rate. So for example as a channel decreases in cross sectional area then flow rate decrease, therefore resistance increases (flow rate also dependent of viscosity and density of fluid). The current of the system is flow rate. The following defines the elements more specifically:
- Flow/Current: Volume (fluid) flow, $ G \left[m^{3}\cdot s^{-1}\right] $
- Potential: Pressure drop, $ P \left[psi\right] $
- Integrating Element: Inertance, $ M $
- $ G = \frac{1}{M} \int \rho {\mathrm{d} t} $
- e.g., for pipe: $ M = \rho*\frac{L}{A} $
- Fluid resistance: $ R \left[m^3\cdot s^{-1}\cdot psi^{-1}\right] $
- $ R = \frac{G}{P} $
- Fluid capacitance: $ C, \left[m^{3}\cdot psi^{-1}\right] $
- $ G = C*\frac{\mathrm{d} P}{\mathrm{d} t} $
Design 1
The first design attempted to place the 'ground' pressure around $ P_{C} = 10psi $ and then have upstream pressures around $ P_{A} = P_{B} = 15psi $. This was done to avoid any inconstancies of working at atmospheric pressure.
Design Problems
- Needed to bring system pressures to atm when replacing samples
- solution: add solenoid switch to easily bring system to atm
- The upstream capacitors did not immediately equalize to downstream capacitor so there was fluid back flow due to pressure differences during the time between 'flow' and 'stopped' states. A video of this can be seen on the course server (INSERT LINK)
Design 2
The second design attempted to place the 'ground' pressure $ P_{C} = 0 psi $ or atm and then have upstream pressures around $ P_{A} = P_{B} = 2 psi $.
Design Problems
- Hydrostatic fluid flow was most seen in this design out of the 3
- Still had problems with bringing upstream pressures to atm (0 psi) fast enough to avoid fluid back flow
Design 3
The third design attempted to address the problem of equalizing pressures fast enough to stop fluid flow and maintain a chemoeffector band width. I added large bypass resistors to ground to all three of the capacitors. This should allow the pressure to equalize to downstream pressure a lot quicker. I used manual fluid valves and crimped tubing to create a large resistance. A second electro-pressure regulator was acquired from the Manalis lab and used to control the pressure of inlet A.
Design Results
- At one point this system design gave promising results with a stopped flow with a controlled center band width. This only worked once out of five attempts to flow fluid and then stop the fluid to set up chemotaxis assay.
Design 3 Problems
- Very difficult to set up large resistance with manual fluid valves
- 7μm diameter beads clogged crimped sections of tubing. Ecoli and bacterial cells are around 1μm in dimension so this may be a problem when setting up chemotaxis assays
Overall Design Problems
- Hydrostatic flow due to changes in reservoir volumes and reservoir height. This was a major problem with the system. The most difficult aspect of this problem is that as sample fluid flows then reservoir heights change and affect hydrostatic flow during experimental set up.
- solution: placed reservoir samples on height adjustable stages. This still does not address the problem of reservoir volumes and heights changing during fluid flow and experimental set up. To reduce this change during fluid flow is to use reservoirs with a larger surface area, or basin.
- Should us fluid tubing with smaller ID to give a larger resistance so that you need a larger pressure change for a change in fluid flow.
Experiment 1:
Summary
Set up Design 1 experiment to measure fluid flow through inlets A and B by conservation of volume. Placed known amounts of water into small test tube and time how long it takes for the fluid to flow through the device.
Methods
Initial Pressures Values:
- Base = 13 psi
- inlet A = inlet B = 15psi
- dP = 2psi
- Trial 1:
- Inlet A: 2mL in 26.5 seconds (*1error, do not include result in final calc)
- (replaced fluid for inlet A in order to measure the remaining time for inlet B fluid to go through [Qb])
- 1error: I forgot to set the base pressure back to 13psi, need to redo the experiment in order to measure both inlet A and inlet B flow rates during the same trial/run. This will cause less variation in the results.
- Trial 2:
- Note: adjusted height of vials A & B so that there was no hydrodynamic flow caused by
- Inlet A: 2mL in 24.7s
- (replaced fluid for inlet A in order to measure the remaining time for inlet B fluid to go through [Qb])
- Note: small bubble in inlet B tubing, might affect fluid flow by small insignificant amount
- Note: small (~1mm diameter) bubble formed 2mm downstream of microinjector, this could affect my results
- inlet B: 2mL in 3:37
- Trial 3:
- Note: small (~1mm diameter) bubble formed 2mm downstream of microinjector, this could affect my results
- Inlet A: 3ml in 36.5s
- (replaced fluid for inlet A in order to measure the remaining time for inlet B fluid to go through [Qb]) microinjector, this could affect my results
- 1error: I forgot to set the base pressure back to 13psi, need to redo the experiment in order to measure both inlet A and inlet B flow rates during the same trial/run. This will cause less variation in the results.
- Trial 4
- inlet A: not measuring, just placed lots of water to be able to measure inlet B flow rate
- Note: small (~1mm diameter) bubble formed 2mm downstream of microinjector, this could affect my results
- 0.5mL in 1:17 (predicted to be 1:45s from trial 2 results)
- Trial 5
- inlet A: not measuring, just placed lots of water to be able to measure inlet B flow rate
- Note: no bubble downstream of microinjector this time
- 1mL in 2:36 (predicted to be ~3:30s from trial 2 results)
NOTE: Steve Wasserman helped me add an 'on/off' switch to trigger solenoids for inlets A & B. Big improvement to get parallel fluid flowing without any delay between the two.
- Trial 6
- inlet A: not measuring, just placed lots of water to be able to measure inlet B flow rate
- Note: no bubble downstream of microinjector this time
- 1mL in 1:59 (predicted to be ~3:30s from trial 2 results)
Results
- inlet A flow rate (n = 3)
- 79.5 μL/s (std 3.6)
- 530.3 mm/s (std 23.9)
- inlet B flow rate (n = 4)
- 7.6 μL/s (std 1.4)
- 1526.2 mm/s (std 280.3)
Conclusion: These flow rates are way too fast and cause a large waste of sample during experimental set up. The solution to this is to increase fluidic resistance in the tubes feeding into inlets A and B. This was done by crimping tubing with a hemostat. Fluid flow was reduced by ~5 fold.
Project Conclusion
This project of implementing a pneumatic approach for fluid flow in chemotaxis assays brought potential for high throughput experimental set up but the precise control of the fluid (chemoeffector band width and stoppped flow) needs to be improved.
From this project I learned:
- An instrument never works on the first try. no matter how much you model and predict its behaviors, something always goes wrong. You have to do it in order to understand it 100%
- IF it does work there is always something to improve
- How to model fluidics and pneumatics as a lumped element circuit model
This projects results provides the following towards high through put Chemotaxis Assay:
- Computer controlled and regulated fluid flow for chemotaxis microfluidic device. This approach still needs further development in getting fluid flow to stop without any hydrostatic back flow.
Future work:
- Right now, the three designs presented above provide fast fluid flow with design 1 providing the best fluid flow rate and chemoeffector band width control. However, the results were largely dependent on how good the user was in equalizing the sample reservoir heights to avoid unwanted hydrostatic flow.
- The best approach to stopping fluid flow with as little inertial flow is by implementing a electro regulated fluid valve that physically stops flow
LabView Calibrations
QPV Electro Regulator: .34V/psi +-.03
- By Emmanuel Quiroz
