20.109(F23):M1D6

Contents
Introduction
In this module we used two methods to assess DNA damage and repair in response to treatment with H2O2 +/- As: the γH2AX assay and the CometChip assay.

The core BER pathway includes only four proteins that function to remove the damaged base and replace it with the correct base. First, a DNA glycosylase recognizes that a damaged base is present in the DNA and cleaves an N-glycosidic bond, which creates an apurinic or apyrimidinic site (referred to as an AP site in both cases). Different DNA glycosylases recognize different types of base lesions. Second, the DNA backbone is cleaved to create a single-strand DNA nick by either a DNA AP endonuclease or a DNA AP lyase. Next, a DNA polymerase incorporates the correct base using the sister strand as a template. Last, a DNA ligase completes the repair by sealing the single-strand nick, which restores integrity to the helix. It is important to recognize that the oxidative damage caused by H2O2 does not generate DNA strand breaks, instead the BER pathways generates single-strand breaks as part of the repair process! Exposure to As potentially exacerbates this by inhibiting the ligation step that is crucial in the final step of the BER pathway.
So how does the biology fit into the experiments used to assess DNA damage and repair in response to treatment with H2O2 +/- As?
In the γH2AX assay, DNA double-strand breaks are visualized using immunofluoresence microscopy. When a DNA double-strand break is introduced into the DNA, the H2AX histones near the break are phosphorylated. Upon phosphorylation H2AX is referred to as gamma-H2AX. Given that only H2AX histones near the site of DNA damage are phosphorylated, γH2AX is a useful target when determining the abundance and location of double-strand breaks. Remember that the DNA damage expected to occur in response to H2O2 is single-stranded breaks. The logic for performing the γH2AX experiment is that multiple single-stranded breaks that are not repaired will lead to double-stranded breaks.
Today you will analyze data acquired using the CometChip assay. The CometChip is a method that allows for the direct measurement of single-strand breaks. In this assay cells are treated, loaded into the CometChip, then lysed to release the DNA into the microwell. Following cell lysis, the CometChip is incubated in an alkaline buffer that unwinds the DNA. This step allows for all types of DNA damage to be detected. Lastly, gel electrophoresis is used to separate the DNA fragments. DNA fragments migrate away from the microwell and generate a comet tail that is a measure of the extent of DNA damage.
One final aspect of our experiments that is important to interpreting the results is that we measured DNA damage over time so that repair could be assessed. The level of DNA damage was measured over a timecourse in both assays that were used. By determining the amount of DNA damage that persisted over time after the H2O2 +/- As treatment, it is possible to make inferences regarding the extent of repair that occurred in the treated cells.
Protocols
Part 1: Participate in Communication Lab workshop
Our communication instructor, Dr. Chiara Ricci-Tam, will join us today for a discussion on writing paper titles and abstracts.
Part 2: Image CometChip experiment
To ensure you are familiar with the steps involved in imaging the CometChip experiment, please watch the video tutorial linked here: [CometChip Imaging].
Part 3: Analyze CometChip images
To complete this analysis, you may chose to use a laboratory computer (one per group) or your personal computer. Please note that the analysis tools have been tested on the laboratory computers and that the instructors may not be able to assist you in troubleshooting issues on your personal computer.
- First, obtain the CometChip images from the Dropbox folder for for your team. The data is separated by section and team in the folder titled 'CometChip'. Download your entire data folder to your computer; it should save as a .zip file.
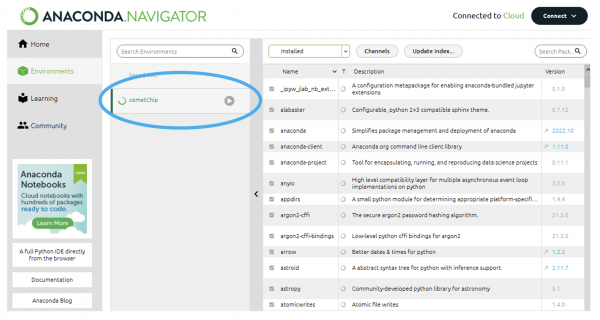
- Open the Anaconda Navigator and select the Environments Menu from the toolbar on the left side of the window.
- The icon for Anaconda Navigator is a green circle on the desktop bar.
- Check to make sure that the CometChip environment is selected and active.

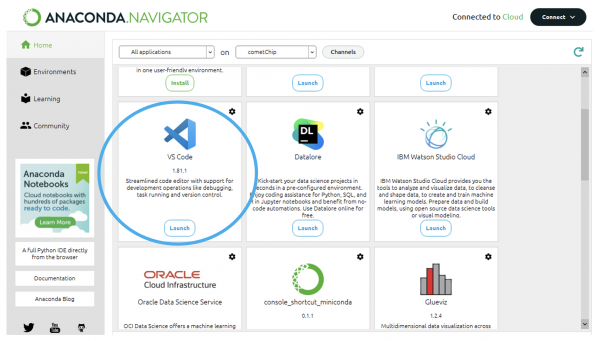
- Return to the Home tab and open Visual Studio Code (VS Code).
- Open comet_analysis_gui_220719 in the Downloads directory using VSC.
- Select “Run” in VSC and name your file.
- The “Run” button is in the top right corner of the window.
- In the Multiwell Comet Analyzer window change the “Saturation Percentage” to 5.
- This option normalizes intensity data to assume that 5% of pixels are saturated. Increasing saturation percentage helps with analyzing overexposed images, if they happen to be overexposed.
- Leave the other parameters in the default settings.
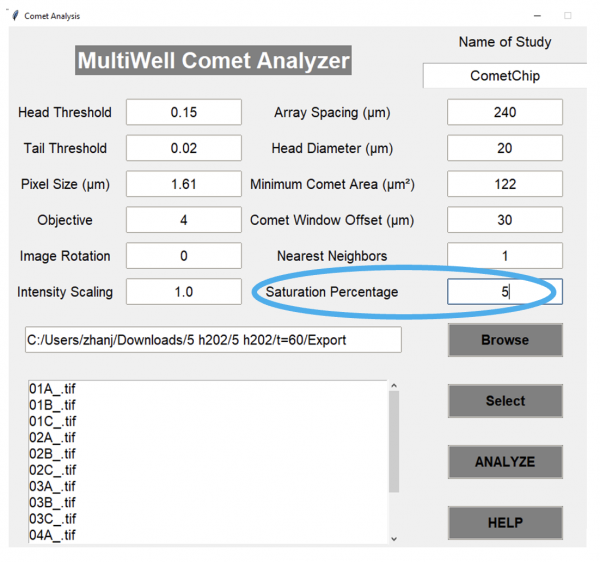
- Select “Browse” from the options in the bottom right of the window.
- Find your images, then hit “Select Folder”. Navigate to the folder containing your data.
- Ensure that the folder contains .tif files, and not nd2 files.
- Highlight the wells that you would like to analyze.
- You can hold shift/ctrl and drag to select multiple wells.
- Hit “Select”.
- Hit “Analyze”.
- The program will write the following files in the directory containing your images:
- “Analyzed” images with white boxes drawn over where the program determined where comets were
- An Excel sheet that contains the data from the analysis done. The first sheet is a summary of all the CometChip data. All additional tabs represent data acquired from individual macrowells.


In your laboratory notebook, complete the following:
- Review the data in the excel files for two macrowells per treatment condition (no treatment, H2O2, As, H2O2 + As).
- Are the values consistent across % tail DNA measured for the individual comets?
- Do you have confidence in these data? Why or why not?
Part 4: Evaluate DNA repair using CometChip assay
The data from the CometChip experiment were compiled into an Excel spreadsheet (linked here). Use this spreadsheet to analyze the data for each of the treatments tested.
- First, orient yourself to the data that are provided in the spreadsheet.
- The values grouped together in the table are for the samples that were treated with 5 μM H2O2. The values at the bottom of the sheet are for the no H2O2 samples.
- The information for the timepoints (0 min, 15 min, 30 min, and 60 min) down the left side of the tables. Each condition was tested in triplicate.
- The information for the As concentration exposure (0 μM, 5 μM, 10 μM, 20 μM, and 40 μM) is across the top of each table.
- Average the replicate samples for each condition and plot the data using a line graph.
- To represent the data as a timecourse, use t = -15m for the no H2O2 value. For the remaining data, use t = 0, t = 30, and t = 60 to indicate the length of time that repair was allowed to occur following H2O2 treatment. Time should be represented on the x-axis.
- On the y-axis, plot the averaged % Tail DNA value for each condition.
In your laboratory notebook, complete the following:
- Attach the spreadsheet that contains your analyzed CometChip data.
- Compare the analyzed data to the raw images that were acquired for each of the treatment conditions.
- Review the representative .tif files for each condition tested (linked here).
- Do the images appear consistent with the values in the analyzed data?
- Do you have confidence in these data? Why or why not?
- Select 1-2 comets for each condition to serve as representative images in your Data summary. Representative images are often included in figures with the analyzed data to show the reader the raw form of the data. It also provides context for how the experiment was performed.
Next day: Examine experimental data using statistical methods