Difference between revisions of "20.109(S19):Complete data analysis (Day9)"
Noreen Lyell (Talk | contribs) (→Introduction) |
Noreen Lyell (Talk | contribs) (→Introduction) |
||
| Line 5: | Line 5: | ||
==Introduction== | ==Introduction== | ||
The CellTiter-Glo Luminescent Cell Viability Assay is a method for quantifying the number of viable cells based on measuring the amount of ATP present. ATP is a proxy for the presence of metabolically active (alive) cells. In this assay, the cells are lysed and ATP is released from the active cells. In a reaction catalyzed by a propriety luciferase enzyme, luciferin, ATP, and oxygen result in oxyluciferin, AMP, PP<sub>i</sub>, carbon dioxide, and light. The light product is then measured using a luminometer. | The CellTiter-Glo Luminescent Cell Viability Assay is a method for quantifying the number of viable cells based on measuring the amount of ATP present. ATP is a proxy for the presence of metabolically active (alive) cells. In this assay, the cells are lysed and ATP is released from the active cells. In a reaction catalyzed by a propriety luciferase enzyme, luciferin, ATP, and oxygen result in oxyluciferin, AMP, PP<sub>i</sub>, carbon dioxide, and light. The light product is then measured using a luminometer. | ||
| − | [[Image:Sp19 cell titer glo assay.png|center|thumb| | + | [[Image:Sp19 cell titer glo assay.png|center|thumb|500px]] |
===Part 1: Examine qPCR results=== | ===Part 1: Examine qPCR results=== | ||
Revision as of 14:21, 8 April 2019

Contents
Introduction
The CellTiter-Glo Luminescent Cell Viability Assay is a method for quantifying the number of viable cells based on measuring the amount of ATP present. ATP is a proxy for the presence of metabolically active (alive) cells. In this assay, the cells are lysed and ATP is released from the active cells. In a reaction catalyzed by a propriety luciferase enzyme, luciferin, ATP, and oxygen result in oxyluciferin, AMP, PPi, carbon dioxide, and light. The light product is then measured using a luminometer.

Part 1: Examine qPCR results
Before you can apply the statistical tools you learned in Mod1 to your data, you must first normalize the expression levels of your gene of interest and p21. To account for any unintended biases in RNA purification and / or cDNA preparation, it is important to normalize the expression of the transcript of interest to expression of a housekeeping or constitutive gene. Ideally, the gene to which the data of interest are normalized is not responsive to the treatment tested. In our experiment, we used GAPDH because it is not expected to be responsive to etoposide treatment. How might you confirm this assumption?
- Review your data posted on the Class data page.
- Remember you prepared DLD-1, DLD-1 +etoposide, BRCA2-/- , and BRCA2-/- +etoposide samples.
- All samples were probed using the primers you designed to your gene of interest, along with the p21 and GAPDH primers.
- Each reaction was completed in triplicate. Note: these are technical replicates.
- The data are represented as the 'threshold cycle' CT or amplification cycle at which SYBR Green fluorescent signal was detected (review M2D5 Introduction).
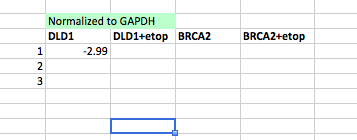
- Normalize the p21 expression to GAPDH expression (ΔCT).
- Subtract the GAPDH CT value from the p21 CT values using the appropriate treatment conditions, according to the screenshot below.

- Subtract the GAPDH CT value from the p21 CT values using the appropriate treatment conditions, according to the screenshot below.
- Exponentially transform each normalized value to the ΔCT expression.
- ΔCT expression = 2-ΔCT.
- Average the replicates for each treatment, then calculate the 95% CI and t-test p-value.
- With this information, graph your data with error bars and include information concerning any statistical significance.
- Are these results consistent with those from the RNA-seq data for p21 expression?
- Load the data:
load("~/Desktop/RNA-seq data analysis/preprocessed_data.RData")- library("DESeq2")
- Plot the reads for p21 (also called CDKN1A):
plotCounts(dds,"CDKN1A", intgroup="group")
- If you would like to save the actual count values, save it to a variable:
data <- plotCounts(dds,"CDKN1A", intgroup="group", returnData=TRUE)
- Load the data:

In case you need the data files to load: preprocessed_data.RData and afterAnalysis.RData
Part 2: Complete cell viability data analysis
Pool the data by drug and use the statistical tools you learned in Mod1 to analyze the relevant class data for your Research Article.
- Review your data posted on the Class data page.
- The data are represented as raw luminescent vales (arbitrary units).
- Subtract the average of the three ‘no cells control’ from all of the luminescent vales. This is the background luminescence.
- Normalize your luminescence values by dividing all wells by the ‘no DNA damage controls’ value for the appropriate cell line. This gives you viability as the “% of control.”
- You can average class data to include error bars and information concerning statistical significance.
Next day: Grow phage-based active (cathode) material