Difference between revisions of "20.109(F17):Visualize and analyze data for sub-nuclear foci assay (Day7)"
Noreen Lyell (Talk | contribs) (Created page with "<div style="padding: 10px; width: 820px; border: 5px solid #6E6E6E;"> {{Template:20.109(F17)}} ==Introduction== ==Protocols== ==Reagents list== ==Navigation links== Next d...") |
Noreen Lyell (Talk | contribs) (→Introduction) |
||
| Line 3: | Line 3: | ||
==Introduction== | ==Introduction== | ||
| + | As a brief reminder, two antibodies were used in the gamma-H2AX assay. The first antibody, or primary antibody, was anti-gamma-H2AX and raised in a mouse. The secondary antibody was anti-mouse and raised in a goat, more importantly, this molecule is conjugated to a fluorescent dye tag called Alexa Fluor 488. The Alexa Fluor 488 tag is a bright, green fluorescent dye that is excited at 488 nm. To visualize the abundance of double-strand breaks in your H2AX assay samples, we will use fluorescence microscopy. | ||
| + | |||
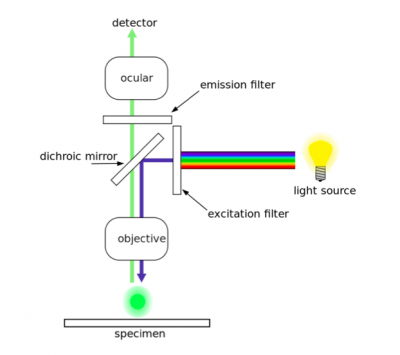
| + | [[Image:Fa16 M1D7 fluorescence microscope.png|thumb|center|400px|'''Diagram of a fluorescence microscope.''']] | ||
| + | |||
| + | In fluorescence microscopy the specimen is illuminated with a wavelength of light specific to the excitation of the fluorescent tag used to target the feature of interest. The excitation wavelength is absorbed by the fluorescent tag, which causes it to emit light at a longer, less energetic wavelength. Typically, fluorescence microscopes used in biology are an epifluorescence type with a single light path (the objective) for excitation and emission detection, as depicted in the diagram above. | ||
| + | |||
| + | Fluorescence, or epifluorescence, microscopes are composed of a light source, an excitation filter, a dichroic mirror, and an emission filter. The filters and the dichroic mirror are specific to the spectral excitation and emission characteristics of the fluorescent tag. To visualize fluorescence, light at the excitation wavelength is focused on the sample. The light emission from the sample is focused by the objective to a detector. | ||
| + | |||
| + | Today you will image the samples you tested using the gamma-H2AX assay and complete complete the data analysis. | ||
==Protocols== | ==Protocols== | ||
Revision as of 16:31, 20 September 2017
Introduction
As a brief reminder, two antibodies were used in the gamma-H2AX assay. The first antibody, or primary antibody, was anti-gamma-H2AX and raised in a mouse. The secondary antibody was anti-mouse and raised in a goat, more importantly, this molecule is conjugated to a fluorescent dye tag called Alexa Fluor 488. The Alexa Fluor 488 tag is a bright, green fluorescent dye that is excited at 488 nm. To visualize the abundance of double-strand breaks in your H2AX assay samples, we will use fluorescence microscopy.
In fluorescence microscopy the specimen is illuminated with a wavelength of light specific to the excitation of the fluorescent tag used to target the feature of interest. The excitation wavelength is absorbed by the fluorescent tag, which causes it to emit light at a longer, less energetic wavelength. Typically, fluorescence microscopes used in biology are an epifluorescence type with a single light path (the objective) for excitation and emission detection, as depicted in the diagram above.
Fluorescence, or epifluorescence, microscopes are composed of a light source, an excitation filter, a dichroic mirror, and an emission filter. The filters and the dichroic mirror are specific to the spectral excitation and emission characteristics of the fluorescent tag. To visualize fluorescence, light at the excitation wavelength is focused on the sample. The light emission from the sample is focused by the objective to a detector.
Today you will image the samples you tested using the gamma-H2AX assay and complete complete the data analysis.
Protocols
Reagents list
Next day:
Previous day: Examine sub-nuclear foci abundance to measure DNA damage
