Optical Microscopy Part 2: Fluorescence Microscopy


Overview

In this part of the lab, you will add epifluorescence imaging capability to your microscope, make images of fluorescent samples, and process the images to correct artifacts caused by nonuniform illumination. The samples you will image include fluorescent microspheres of several sizes and cells stained with a fluorescent dye. A typical spectrum is shown on the right. The excitation light source is a 5 mW diode laser with a nominal wavelength of 532 nm — a striking, brilliant green. Emission is in the red/orange range. To make the correction for nonuniform illumination, you will also make images of a uniform fluorescence reference slide and a dark image with the illuminator turned off.

As shown in the block diagram, the major components required for fluorescence imaging are an illuminator (laser, L3, L4, and L5), dichroic mirror (DM), and emission filter (BF). The illuminator provides light in the appropriate wavelength range to excite the fluorescent molecules in the sample. Fluorescence microscopes that use broadand light sources such as arc lamps require an additional filter called an excitation filter to limit the wavelengths in the illumination to the proper range. Because lasers emit light in a very narrow range of wavelengths, an excitation filter is unnecessary.

Excitation light comes from beneath the sample, through the objective lens. A dichroic mirror directs the excitation toward the objective and sample. The mirror must reflect wavelengths in the excitation range and pass the longer wavelengths of the emitted fluorescence. In fluorescence imaging, illumination intensity is typically 5 or 6 orders of magnitude greater than emitted fluorescence, so it is crucial to filter out excitation photons as completely as possible. The dichroic mirror passes a substantial amount of green light, on the order of five percent. The barrier filter does a much better job of removing the green light, attenuating the excitation wavelengths by about 5 orders of magnitude. The barrier filter is essential for making crisp, high-contrast images.
To provide collimated illumination in the sample plane, light from the illuminator is focused at the back focal point of the objective.
Laser safety
In this part of the lab, you will use a 5mW, 532 nm laser with focusing optics. You must attend the safety lecture before you work with the laser. See an instructor if you missed the lecture. Do not begin working with the laser until you thoroughly understand how to use it safely.
Stop working and ask an instructor immediately if you have any questions about working with lasers safely.
When you work with lasers, keep these laser safety best practices in mind:
- Remove reflective clothing items and jewelry when working with lasers.
- Use the lowest possible power during alignment or adjustment.
- Do not use reflective tools when the laser is on.
- Know the beam path at all times.
- Use a stop to prevent uncontained beams.
- Secure the stop so it will not move accidentally.
- Keep your eyes out of the plane of the beam, which his normally a plane just above the optical table.
- Disable lasers when they are not in use.
- Use the correct safety goggles.
- Always check the marking on the goggles to ensure they are appropriate for the laser you are working with.
- Laser safety goggles are a last line of defense, not an excuse for unsafe practices.
- Do not operate a laser unless the flashing laser warning sign is on.
Some specific ways to work safely with the 20.309 fluorescence microscope:
- Use an OD = 2 neutral density (ND) filter to attenuate the laser near the source.
- "OD" is an abbreviation for "optical density," which is log10 of the power transmitted by the filter divided by the incident power.
- "ND" means that the OD is equal for all wavelengths.
- The ND filter attenuates the power of the laser by a factor of 102, to about 50 μW, which is completely safe.
- Mount the ND filter securely so there is no chance that it will get knocked out of place accidentally.
- The inverted microscope design directs laser light upward, toward the ceiling. Do not lean over the objective mount. Use a stop to prevent the beam from propagating above your microscope.
- Confine beams inside lens tubes.
- Disable the laser when it is unattended or stored by removing a battery, disconnecting the power source, or removing the key.
- Safety goggles for the laser in this lab should have an OD of at least 2 at 532 nm.
- There are (at least) two different kinds of safety goggles in the lab that are appropriate for this lab. One has an OD of 2 at 532 nm and the other has an OD of 5. You can see the beam with the OD = 2 goggles, but the power is reduced to a safe level. This makes the OD 2 laser goggles very useful for making adjustments that must be done at full power.
Add laser illuminator, dichroic mirror, and barrier filter

- Go over your design with one of the instructors before you start building.
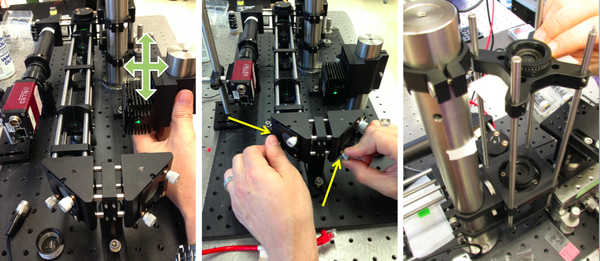
- Use cage rods to construct a cage of appropriate size for the beam expander and excitation tube lens (L3, L4, and L5).
- For maximum flexibility in positioning, removing, and reinstalling optics, use 3 cage rods instead of 4. Use a cage plate (CP02) for each lens. Mount the lens in a 1/2" lens tube (SM1L05) so it can be easily removed or installed.
- Add the two turning mirrors to the end of the cage.
- Use a thick cage plate (CP02T) only to join 2 cages. (You will use a total of two CP02T plates in your microscope.) Don't use CP02T to mount lenses — there are not enough of them in the lab to use this way. It is easy to tell the difference. CP02T has 8 set screws and is roughly twice as thick as the CP02; CP02 has 4 set screws.
- Use a cube optic mount (B5C) to mount dichroic mirror DM on a kinematic platform (B4C) . Place the kinematic platform in the cage cube (C6W).
- The first surface of the dichroic should face the laser.
- Some dichroics have an arrow indicating the first surface. If not, to ascertain which surface has the coating, watch the reflection of a corner of a piece of lens paper as it touches the mirror. On the first surface, the corner and its reflection will appear to touch. Held the other way, the corner and its image will appear a few millimeters apart.
- Mount the dichroic so that the first surface lies on exactly a diameter of the B5C mount.
- The mounting bracket should not stand in the way of the rotation of the kinematic stage.
- Use the clear plastic #4/40 screws affix the dichroic mirror without deforming nor scratching its surface.
- Hold the screwdriver at the tip to avoid slipping and scratching the dichroic. The screwdriver will instantly scratch the dichroic.
-
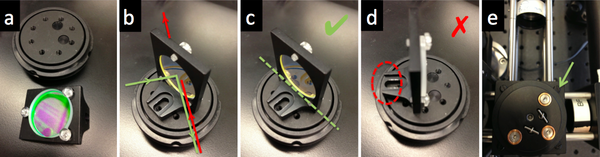 Dichroic mirror mount
- Ask an instructor for help if you need to clean a dichroic mirror or barrier filter. Dichroics have delicate, exposed coatings and must be cleaned with extra care.
- The first surface of the dichroic should face the laser.
- Use four black, plastic #4/40 screws to hold the cube optic mount (B5C) on the cage cube (C6W).
- Tighten the screws enough so that the cube optic mount holds its adjustment, but can still be rotated.
- Make sure to block the (small percentage of) excitation laser light that will be transmitted through the dichroic mirror with some black lab tape affixed to the B5C cube optic mount.

Align the laser illumination path
- Remove L3, L4, L5, and the objective lens L1.
- Mount the laser.
- Insert a neutral density filter (ND filter) between the laser and M2 to reduce the laser power to a safe level for adjustment.
- Remove jewelry. Turn of the laser before using reflective tools.
- Turn on the laser. Use a beam stop until the laser position is set. Adjust the laser position so that the laser shines near the middle of M2.
- You can use a DG10 mounted frosted-glass alignment disk with a pinhole to best center the laser beam onto M2.
- Adjust M2 and M3 to center the laser light in the cage.
- Use two CPA1 alignment targets to gauge beam alignment.
-
 Using pinholes and irises to optimize initial microscope alignment
- Adjust the dichroic mirror DM so that the beam will enter the middle of the objective lens.
- Use a DG10 mounted frosted-glass alignment disk with a pinhole to show the optical center of the vertical beam path.
- Verify that the centered beam is perpendicular to the floor. If the beam is at an angle, verify that the dichroic mirror DM is mounted on a diameter of the rotating mount.
- Insert the beam expander lenses, L3 and L4. Adjust the separation between L3 and L4 to achieve a collimated beam.
- It may be necessary to make small adjustments to M2 and M3 to recenter the beam.
- Replace the excitation tube lens L5 and the objective lens L1. Adjust the position of L5 for best beam collimation.
- The product of beam divergence and diameter is constant. L5 and L1 shrink the beam, causing increased divergence. The beam emerging from the objective will likely appear to grow in size as it propagates, even when the lenses are in their optimal positions.
- It may be necessary to make small adjustments to M2 and M3 to recenter the beam.
- Use a fluorescence reference slide to center the field of view and to optimize the uniformity of illumination.
- Make sure to use an ND filter when you use the fluorescence reference slide. The slide bleaches quickly at high intensities and you will not get a good image.
- Put a barrier filter in the afocal part of the imaging path.
- Center the camera's FOV in the objective's FOV.
- If the laser light emerges from the objective at an angle, double-check your alignment and dichroic mounting.
- The barrier filter has delicate, exposed metal coatings. Ask an instructor for help if you need to clean it.

Immunofluorescent staining
In this part of the lab, you will investigate how a drug called cytochalasin D (CytoD) affects the structural properties of mammalian cells. Immunofluorescent staining will be used to make the actin cytoskeleton of epithelial cells visible. You will compare the structure of cells that have been treated with CytoD with that of untreated cells.
The mushroom toxin phalloidin binds to polymerized filamentous actin (F-actin) much more tightly than to actin monomers (G-actin), and stabilizes actin filaments by preventing their depolymerization. You will take advantage of this strong affinity between phalloidin and F-actin to image the cell's actin cytoskeleton. Phalloidin conjugated with the fluorescent dye Alexa Fluor 568 will be introduced in Chinese hamster ovary (CHO) cells.
By comparing Alexa Fluor phalloidin-stained untreated cells and CytoD-treated cells, you will observe and quantify the effect CytoD has on the actin stress fiber network. Cytochalasin D is also a mycotoxin, but contrary to phalloidin, it poisons the cell by strongly inhibiting actin polymerization.

|

|
| Example of a NIH 3T3 fibroblast cell labeled with rhodamine phalloidin | Excitation and emission spectra for Alexa Fluor 568 |
| |
Wear gloves when you are handling biological samples. |
Procedures for fixing and labeling cells

You will be given two plates of cells:
- one dish will be left untreated, and then fixed and labeled with phalloidin;
- the second dish will be first treated with CytoD, and then fixed and labeled with phalloidin.
A key technique to keep in mind when working with live cells - to avoid shocking them with "cold" at 20°C - is to be sure that any solutions you add are pre-warmed to 37°C. We will keep a warm-water bath running for this purpose, in which we will keep the various media.
You are provided with CHO cells, which were prepared as follows: Cells were cultured at 37°C in 5% CO$ _2 $ in standard T75 flasks in a medium referred to as DMEM++. This consists of Dulbecco's Modified Eagle Medium (DMEM - Invitrogen) supplemented with 10% fetal bovine serum (FBS - Invitrogen), 1% of the antibiotic penicillin-streptomycin (Invitrogen), 1% non-essential amino acids, and 1% glutamine. The day prior to the microrheology experiments, cells were plated on 35 mm glass-bottom cell culture dishes (MatTek, equipped with coverslip suited for optical microscopy studies).
Dish 1
Below is the protocol to stain CHO cells with Alexa Fluor 568 phalloidin:
- Start with cells about 60% confluent. This is about the optimum percentage of cell population. If cells are too crowded, they will not stretch properly and show their beautiful actin filaments. Note also that these cells remain alive until the addition of formaldehyde, therefore requiring that any buffer/media added be pre-warmed.
- Pre-warm 3.7% formaldehyde solution and phosphate buffered saline at pH 7.4 (PBS) in a 37°C water bath. Keep the formaldehyde wrapped in foil to protect from light.
- Retrieve an aliquot of cytochalasin D from the freezer and warm it in the water bath to 37°C.
- After you get your dishes from the instructor, first remove the medium with a pipette and wash the dish 2X with 2 mL of pre-warmed PBS. Pipet up and down into the dish gently to avoid washing away cells.
- Carefully pipet 400 μL of 3.7% formaldehyde solution onto the cells in the central glass region of the dish and incubate for 10 minutes at room temperature. This "fixes" the cells, i.e. cross-links the intracellular proteins and freezes the cell structure.
- Wash the cells 3X with 1.5 mL PBS (note that this PBS solution no longer needs to be pre-warmed as the cells are dead).
- Extract the dish with 1.5 mL 0.1% Triton X-100 (a detergent) for 3-5 minutes. (Extraction refers to the partially dissolution of the plasma membrane of the cell.)
- Wash the cells 2X with 1.5 mL PBS.
- Incubate the fixed cells with 1.5 mL 1% BSA in PBS for 20 minutes. (BSA blocks the nonspecific binding sites.)
- Wash the cells 2X with PBS.
- Add 200 μL of Alexa Fluor 568 phalloidin solution (pre-mixed in methanol and PBS). Carefully pipet this just onto the center of the dish, cover with aluminum foil, and incubate for 45 minutes at room temperature.
- Wash 3X with PBS.
- You can now store the sample at +4°C (regular refrigerator) in PBS for a few days, wrapped in parafilm and foil. It can also be stored in mounting medium for up to 1 year.
Dish 2
- By a very similar procedure, also prepare cells treated with cytochalasin D (CytoD):
- 0. Before adding the formaldehyde, add 1 mL of the pre-warmed 10 μM CytoD solution to the second cell culture dish and incubate at 37°C for 20 minutes (and not a minute longer!). Afterwards, wash 2X with PBS.
Fluorescence imaging

In this part of the lab, you will make images of two sizes of microspheres plus your dishes of cells, and correct them for nonuniform illumination. In order to do the correction, you will need a reference image and a dark image in addition to the image of the sample. Take the reference image as close as possible in time to the sample images. Don't make any adjustments to your microscope between capturing the reference image and the sample image. Adjusting the camera exposure between the reference and sample images is okay. Use 12-bit imaging mode to get the best results. Save your images in a format that preserves all 12 bits. (Remember the example from part 1: imwrite( im2uint16( im2double( 16.0037 * AirForce14lp10x )), 'AirForce14lp10x.png', 'png' );
- Put in an ND filter and take an image of the reference slide with the 40X objective.
- Use the histogram display of the camera software (function imhist in Matlab) to be certain that the image is exposed correctly.
- Remove the ND filter and image the samples:
- 3.26 μm beads,
- 0.84 μm beads, and
- fixed and stained cells, both untreated (Dish 1) and CytoD-treated (Dish 2), in 35-mm MatTek dishes.
- Visualizing the actin cytoskeleton under your 20.309 microscope will require skills. Since actin filaments and stress fibers are nanometer-scale objects, they are much dimmer than fluorescent beads or the dye solution - care must be taken to get good images of the cytoskeleton. You may need to cover the microscope to reduce room light contamination.
- Adjust the gain and exposure of the camera to get the best picture.
- Take a dark image:
- For each sample respectively, turn off the illuminator and record the resulting image, using the exact same Exposure Time and Gain settings you had chosen for your sample image.

Flat field correction
- Perform flat-field correction on the images.
- Divide the image by a normalized version of your reference image minus the dark image.
- Include the original, reference, and flat-field corrected images in your lab report.
Report outline
Find and follow all guidelines on the Microscopy report outline wiki page.
- Microscope documentation
- Include an updated block diagram of your microscope.
- Images
- Include a figure with an images of the 3.26 μm fluorescent microsphere samples, and the stained cell samples with and without Cyto-D.
- For each sample, create 1 figure with 5 panels.
- The panels of the figure should be: A) unprocessed image; B) reference image; C) dark image; D) flat-field corrected image; and E) histogram.
- In the caption, specify the exposure and gain settings. Each image should have a scale bar. State the dimension of the scale bar in the caption.
- For panel E, plot histograms of the unprocessed, dark, reference, and corrected image on the same set of axes. Plot log10( count ) on the vertical axis and intensity on the horizontal axis. Use a line plot instead of a bar chart for the histogram.
- Image profile
- For one reference, dark and cell image set, plot an intensity profile across the same diagonal. You may also use a bead image, along with it's unique reference and dark images. The intensity of your three images should be on the same scale, i.e., 0 to 65,535 or 0 to 1. Place all three profiles on a single set of axes for comparison. (Use the improfile command in MATLAB.)
- Include a figure with an images of the 3.26 μm fluorescent microsphere samples, and the stained cell samples with and without Cyto-D.
- Discussion
- How did your beam expander design affect your images?
- What differences did you observe between the cells with and without CytoD?
Optical microscopy lab
Code examples and simulations
- Converting Gaussian fit to Rayleigh resolution
- MATLAB: Estimating resolution from a PSF slide image
- Matlab: Scalebars
- Calculating MSD and Diffusion Coefficients