Difference between revisions of "Lab Manual: Optical Microscopy"
(→Introduction) |
Steven Nagle (Talk | contribs) (→Week 3: particle tracking) |
||
| Line 89: | Line 89: | ||
** Track suspended microspheres | ** Track suspended microspheres | ||
** Estimate diffusion coefficients in a Newtonian fluid; calculate viscosities | ** Estimate diffusion coefficients in a Newtonian fluid; calculate viscosities | ||
| + | * Turn in Week 3 report | ||
====Week 4: cellular microrheology==== | ====Week 4: cellular microrheology==== | ||
Revision as of 11:10, 4 September 2013
| 1665 | 2009 |
|---|---|
|
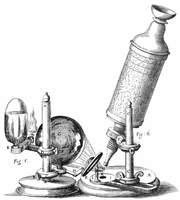
Robert Hooke's microscope |
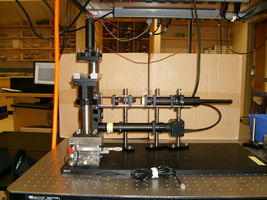
20.309 student's microscope |
|
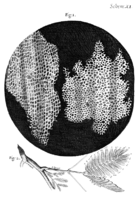
Hooke micrograph of cork cells |
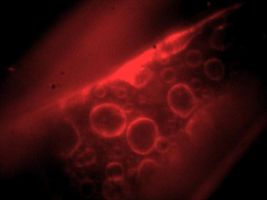
CCD image of fluorescent labeled intracellular membranes[1] |
I took a good clear piece of Cork, and with a Pen-knife sharpen'd as keen as a Razor, I cut a piece of it off, and thereby left the surface of it exceeding smooth, then examining it very diligently with a Microscope, me thought I could perceive it to appear a little porous; but I could not so plainly distinguish them, as to be sure that they were pores, much less what Figure they were of: But judging from the lightness and yielding quality of the Cork, that certainly the texture could not be so curious, but that possibly, if I could use some further diligence, I might find it to be discernable with a Microscope, I with the same sharp Penknife, cut off from the former smooth surface an exceeding thin piece of it, and placing it on a black object Plate, because it was it self a white body, and casting the light on it with a deep plano-convex Glass, I could exceeding plainly perceive it to be all perforated and porous, much like a Honey-comb, but that the pores of it were not regular; yet it was not unlike a Honey-comb in these particulars.
I told several lines of these pores, and found that there were usually about threescore of these small Cells placed end-ways in the eighteenth part of an Inch in length, whence I concluded there must be neer eleven hundred of them, or somewhat more then a thousand in the length of an Inch, and therefore in a square Inch above a Million, or 1166400. and in a Cubick Inch, above twelve hundred Millions, or 1259712000. a thing almost incredible, did not our Microscope assure us of it by ocular demonstration.
Since Robert Hooke noticed that the pores in a very thin sample of cork reminded him of the small rooms called cells where monks sleep in a monastery, the optical microscope has been a tool of central importance in life science. But Hooke did more than just notice the sample's texture. He also made perhaps the first quantitative measurements of cells with an optical microscope: he measured the size of cells.
Improvements in optical components, microscope designs, illuminators, imaging devices, and sample preparation methodologies fostered increasingly sophisticated discoveries in the three and a half centuries since Micrographia. Barbara McClintock observed genetic transposition through an optical microscope by in 1944, for example. She was a talented microscopist who developed a technique that let her visualize and differentiate individual chromosomes in Zea Mays (corn) plant cells. McClintock was awarded the Nobel Prize in Physiology or Medicine in 1983 for this discovery. It took several decades before molecular techniques sufficiently sophisticated to confirm her discovery were developed.[3]
Introduction
In this lab, you will design and build an optical microscope from components. You will characterize the performance of your instrument and make images using two different contrast methods: transmitted brightfield and epifluorescence. Using particle tracking computer software, you will make quantitative measurements of small suspended particles in Brownian motion.
Brightfield transmitted microscopy is the simplest and most common optical microscopy method. In this technique, photons from an illuminator pass through the sample, where they may be absorbed, diffracted, or refracted. (The sample is usually mounted on a glass slide.) An objective lens on the opposite side of the sample collects the light.
Illumination for epi-fluorescence microscopy reaches the sample through the objective lens — from the same side of the sample that is observed. Epi-fluorescence microscopy is normally used on samples that have been labeled with a fluorescent molecule called a fluorophore. The (narrowband) illumination wavelength must match the absorption characteristic of the fluorophore. After becoming excited by a photon from the illuminator, fluorophores emit photons with a longer wavelength. A dichroic mirror in the microscope reflects the illumination wavelength but allows the emitted photons to pass through.
An example microscope made by the instructors will be available in the lab for you to examine. Feel free to make improvements on this design. Mechanical stability will be crucial for the particle tracking experiments in weeks 3 and 4 of the lab. The required stability specification will be achieved through good design and careful construction — not by indiscriminate over-tightening of screws.
Microscope design
The imaging path of the microscope includes an objective lens (L1) and a tube lens (L2). The sample is placed at the front focus of L1, producing collimated light that reflects of mirror M1. L2 forms an image of the sample on a CCD camera. In brightfield mode, collimated light from an LED passes through the sample. A green laser illuminates the sample in epi-fluorescence mode. Laser light passes through a Gallilean beam expander (L3 and L4). L5 focuses the laser beam at the back focus of L1. This arrangements provides collimated sample illumination. Dichroic mirror DM reflects the green light toward the sample and allows emitted red light to pass through.
Objectives and Learning Goals
- Learn about the theory and practice of light microscopy
- Use ray tracing rules to design a transmitted bright field and fluorescent light microscope
- Construct the microscope from optical components
- Characterize the microscope's performance
- Adapt and create signal processing Matlab code for image analysis
- Track moving particles
- Make quantitative measurements of biological systems
- Identify your microscope's limits of detection, and understand their source(s)
- Record, enhance, and analyze microscope images
How to do this lab
Week 1: brightfield microscopy
- Read background references
- Geometrical optics and ray tracing
- Physical optics and resolution
- Lectures 1 through 9 of the 20.309 class
- From Nikon MicroscopyU
- Conjugate planes in optical microscopy Includes transmitted and reflected (epi) illumination.
- Snell's law
- Resolution
- Refer to Optical Microscopy Week 1: Bright Field Microscopy
- Build and characterize a brightfield microscope
- Turn in week 1 report
Week 2: fluorescence microscopy
- Read background references
- Refer to Optical Microscopy Week 2: Fluorescence Microscopy
- Add a laser illumination beam path
- Image fluorescent samples
- Characterize the fluorescent imaging performance of the microscope
- Process images
- Turn in week 2 report
Week 3: particle tracking
- Read Optical Microscopy Week 3: Particle Tracking
- Track fixed beads and measure microscope stability
- Track suspended microspheres
- Estimate diffusion coefficients in a Newtonian fluid; calculate viscosities
- Turn in Week 3 report
Week 4: cellular microrheology
- Read background references
- Refer to: Optical Microscopy Week 4: Microrheology Measurements in Fibroblast Cells
- Image actin in 3T3 cells before and after exposure to cytochalasin D, an inhibitor of actin polymerization
- Measure the frequency-dependent storage and loss modulus of 3T3 cells
How to report on this lab
Follow the guidelines of the suggested report outline.
Lab manual pages
- Lab Manual: Optical Microscopy
- Optical Microscopy Report Outline
- Optical Microscopy Part 1a: Bright Field Microscopy
- Optical Microscopy Part 1b: Geometrical Optics and Ray Tracing
- Optical Microscopy Part 1c: Physical Optics and Limits of Detection
- Optical Microscopy Part 1d: Noise Sources in Light Detection
- Optical Microscopy Part 2: Fluorescence Microscopy
- Optical Microscopy Part 3a: Particle Tracking
- Optical Microscopy Part 3b: Microrheology Measurements in Fibroblast Cells
- Optical Microscopy Part 3c: Protocols for cell culture, cell fixing and cell imaging
References
- ↑ Onion endothelial cell incubated with FM 4-64 dye (Invitrogen). See class stellar site for protocol. Oh & Yamaguchi, unpublished lab report
- ↑ Hooke, R. Micrographia: or Some Physiological Descriptions of Minute Bodies made by Magnifying Glasses with Observations and Inquiries Thereupon London:Jo. Martyn, and Ja. Allestry, Printers to the Royal Society; 1665
- ↑ See, for example: McClintock, B. The origin and behavior of mutable loci in maize. PNAS. 1950; 36:344-355. [1], [2], and Endersby, Jim. A Guinea Pig's History of Biology. Cambridge, Massachusetts: Harvard University Press; 2007.


