Difference between revisions of "Assignment 2 Part 2: Fluorescence microscopy"
MAXINE JONAS (Talk | contribs) (→Use an excitation tube lens to collimate light at the sample plane) |
Juliesutton (Talk | contribs) (→Excitation sources and optical filters) |
||
| (15 intermediate revisions by 3 users not shown) | |||
| Line 54: | Line 54: | ||
==Overview== | ==Overview== | ||
[[Image:Fluorescent minerals.jpg|right|thumb|Naturally fluorescent minerals exposed to ultraviolet light.]] | [[Image:Fluorescent minerals.jpg|right|thumb|Naturally fluorescent minerals exposed to ultraviolet light.]] | ||
| − | The [https://www.youtube.com/watch?v=-YmaSyxTSiU phenomenon] of fluorescence has beguiled both sober and inebriated witnesses since at least the [https://www.fluorescence-foundation.org/lectures%5Cmadrid2010%5Clecture1.pdf late sixteenth century]. Some of the earliest observers noticed an unusual blue tint in water that had been infused with the wood of a Mexican tree called Coatli. Other naturally-occurring fluorescent and phosphorescent materials such as Bologna Stone (baryte), fluorite, and quinine sparked considerable interest from some the most preeminent scientists in all of history. Galileo Galilei, Robert Boyle, David Brewster, John Herschel, and that trippy dude from your high school all spent time contemplating the curious nature and simple beauty of fluorescence. | + | The [https://www.youtube.com/watch?v=-YmaSyxTSiU phenomenon] of fluorescence has beguiled both sober and inebriated witnesses since at least the [https://www.fluorescence-foundation.org/lectures%5Cmadrid2010%5Clecture1.pdf late sixteenth century]. Some of the earliest observers noticed an unusual blue tint in water that had been infused with the wood of a Mexican tree called Coatli. Other naturally-occurring fluorescent and phosphorescent materials such as Bologna Stone (baryte), fluorite, and quinine sparked considerable interest from some the most preeminent scientists in all of history. Galileo Galilei, Robert Boyle, David Brewster, John Herschel, and that trippy dude from your high school with all the black-light posters in his room all spent time contemplating the curious nature and simple beauty of fluorescence. |
[[File:Tonic water fluorescence.jpg|right|thumb|Blue fluorescence of quinine excited by UV light..]] | [[File:Tonic water fluorescence.jpg|right|thumb|Blue fluorescence of quinine excited by UV light..]] | ||
The brilliant physicist and mathemetician George Stokes conducted a particularly clever experiment in which he used a prism to separate sunlight into its component colors. As he moved a vial of quinine sulfate from color to color, Stokes noted that quinine fluoresces only when illuminated by ultraviolet light — the invisible part of the rainbow just beyond the majestic blue band. The vial of quinine did not glow when Stokes placed the it in any other part of the rainbow. Because ultraviolet illumination gave rise to blue light, Stokes concluded that fluorescent emission has a ''longer'' wavelength than the excitation. This observation turns out to be spot on, and in his honor the difference in wavelength between the excitation and emission peak a fluorophore's spectrum is called the ''Stokes shift''. | The brilliant physicist and mathemetician George Stokes conducted a particularly clever experiment in which he used a prism to separate sunlight into its component colors. As he moved a vial of quinine sulfate from color to color, Stokes noted that quinine fluoresces only when illuminated by ultraviolet light — the invisible part of the rainbow just beyond the majestic blue band. The vial of quinine did not glow when Stokes placed the it in any other part of the rainbow. Because ultraviolet illumination gave rise to blue light, Stokes concluded that fluorescent emission has a ''longer'' wavelength than the excitation. This observation turns out to be spot on, and in his honor the difference in wavelength between the excitation and emission peak a fluorophore's spectrum is called the ''Stokes shift''. | ||
| − | Reconciling Stokes' observation with the prevailing theory of light at the time of | + | Reconciling Stokes' observation with the prevailing theory of light at the time of Stokes' experiment proved to be extraordinarily difficult. The classical theory of electromagnetism was the best thing going at the time. In the classical theory, a more intense beam of light has a larger electric field. The classical theory suggested that ''intense'' light ought to excite a fluorescent sample. But Stokes observed that it was the ''color'' of the light instead of its intensity that mattered. Ultraviolet is the only color of light that excites quinine, regardless of how bright any other color is.<ref>This is not perfectly true. We will talk about two-photon excitation later on.</ref> In order to explain Stokes' observation, Albert Einstein had to dream up a whole new model for how light works: the quantum theory. Einstein introduced the idea in one of his "miracle year" papers in 1905 with the dense title of ''Concerning an Heuristic Point of View Toward the Emission and Transformation of light''. It's is a lovely paper, and you should definitely put it on your reading list. In the paper, Einstein posited that light is made out of discrete energy packets (which we now call photons). |
| − | + | The energy of a single photon depends only on its wavelength (color) and is given by the equation: | |
| − | + | ||
| − | The energy of photon depends only on its wavelength (color) and is given by the equation: | + | |
:<math>E=h\nu=\frac{hc}{\lambda}</math>, | :<math>E=h\nu=\frac{hc}{\lambda}</math>, | ||
| Line 70: | Line 68: | ||
===Mechanism of fluorescence=== | ===Mechanism of fluorescence=== | ||
| − | The diagram below depicts the sequence of events that gives rise to fluorescence. The process begins | + | The diagram below depicts the sequence of events that gives rise to fluorescence. The process begins with a molecule absorbing a photon. This increases the amount of energy stored in the molecule. Most of the energy goes into raising the energy level of an electron above its ground state. The remainder goes toward increasing the vibrational energy of the molecule. After absorbance, the molecule very rapidly sheds some of its energy through the processes of vibrational relaxation and internal conversion. Both of these processes convert some of the photon's energy to heat. After that, the molecule returns to its ground state by emitting a photon. Since some of the original photon's energy was lost to heat, the emitted photon has a longer wavelength (and hence lower energy) than the original one. |
<center> | <center> | ||
| Line 76: | Line 74: | ||
</center> | </center> | ||
| − | In 1933, Aleksander Jablonski published a simple diagram similar to the one below. The diagram shows the details of the energy transitions that that take place during fluorescence and phosphorescence. The vertical axis of the diagram represents total energy. Another implication of quantum | + | In 1933, Aleksander Jablonski published a simple diagram similar to the one below. The diagram shows the details of the energy transitions that that take place during fluorescence and phosphorescence. The vertical axis of the diagram represents total energy. Another implication of the quantum theory is that when electrons are confined to a space (for example, bound to a molecule), they can only occupy certain discrete energy levels. Allowable electronic energy levels are indicated by thick horizontal lines. The ground state of the molecule S<sub>0</sub> appears at the bottom of the diagram. Two excited states are shown: S<sub>1</sub> and S<sub>2</sub>. As energy increases, the difference in energy between states gets smaller. Fine horizontal lines above each electronic energy level represent energy stored in vibrational modes of the molecule. (Vibrational energy is also discrete.) Thus, each line represents a possible value for the sum of electronic and vibrational energy. |
<center> | <center> | ||
| Line 82: | Line 80: | ||
</center> | </center> | ||
| − | The possible energy states are grouped into two columns. Each | + | The possible energy states are grouped into two columns. Each column represents a different molecular spin state. The spin state depends on the number of unpaired up/down electron spins. Singlet states (denoted by the letter "S") have no unpaired spins while triplet states (denoted by "T") have two unpaired spins. Don't sweat the details too much. The bottom line is that transitions ''within'' a column are much more likely than transitions that cross columns. Fluorescence does not require an electron to change spin. It is a fast phenomenon that takes place entirely in the lefthand column. Phosphorescence involves an electron changing its spin. The probabilities of the transitions are much lower and hence phosphorescence occurs over a much longer timescale (up to hours). |
| − | It's not a coincidence that fluorescence takes place for the most part in visible wavelengths. | + | It's not a coincidence that fluorescence takes place for the most part in visible wavelengths. The diagram below shows that single photons with wavelengths longer than about 700 nm have energies less than about 1.8 electron volts (2.88×10<sup>-19</sup> J), which roughly corresponds to the energy range of vibrational modes of molecules. Visible photons (λ= 400 - 700 nm) have energies in the same range as the differences between in energy levels of electrons bound to a molecule. X-rays (0.01 - 10 nm) have higher energy — more than enough energy to completely remove an electron from a molecule instead of just exciting it to a higher energy state. Ultraviolet light bridges the gap. |
<center> | <center> | ||
[[File:Energy levels.png|400 px]] | [[File:Energy levels.png|400 px]] | ||
</center> | </center> | ||
| − | |||
==Fluorescence microscope design== | ==Fluorescence microscope design== | ||
| Line 94: | Line 91: | ||
===Excitation sources and optical filters=== | ===Excitation sources and optical filters=== | ||
[[Image:20.309 130911 YourMicroscope.png|center|thumb|400px|20.309 microscope block diagram]] | [[Image:20.309 130911 YourMicroscope.png|center|thumb|400px|20.309 microscope block diagram]] | ||
| − | As shown in the block diagram, the major components required for fluorescence imaging are an illuminator (LED, excitation filter, L3, and L4), dichroic mirror (DM), and emission filter (BF). The illuminator provides light in the appropriate wavelength range to excite the fluorescent molecules in the sample. Fluorescence microscopes that use broadband light sources such as arc lamps and LEDs require an excitation filter to limit the wavelengths in the illumination to the proper range. Fluorescence microscopes that use lasers don't require an excitation filter because lasers emit a very narrow range of wavelengths. | + | As shown in the block diagram, the major components required for fluorescence imaging are an illuminator (LED, excitation filter (EX), L3, and L4), dichroic mirror (DM), and emission filter (or barrier filter, BF). The illuminator provides light in the appropriate wavelength range to excite the fluorescent molecules in the sample. Fluorescence microscopes that use broadband light sources such as arc lamps and LEDs require an excitation filter to limit the wavelengths in the illumination to the proper range. Fluorescence microscopes that use lasers don't require an excitation filter because lasers emit a very narrow range of wavelengths. |
| − | [[Image:Alexa 568 and filters.png|thumb|260px|right|Excitation and emission spectra of Alexa 568 | + | [[Image:Alexa 568 and filters.png|thumb|260px|right|Excitation and emission spectra of Alexa 568 overlaid with the spectra of the excitation, dichroic and emission filters.]] |
| − | + | ||
Excitation light comes from beneath the sample, through the objective lens. A dichroic mirror directs the excitation toward the objective and sample. The mirror must reflect wavelengths in the excitation range and pass the longer wavelengths of the emitted fluorescence. In fluorescence imaging, illumination intensity is typically 5 or 6 orders of magnitude greater than emitted fluorescence, so it is crucial to filter out excitation photons as completely as possible. The dichroic mirror passes a substantial amount of green light, on the order of five percent. The barrier filter does a much better job of removing the green light, attenuating the excitation wavelengths by about 5 orders of magnitude. The barrier filter is essential for making crisp, high-contrast images. | Excitation light comes from beneath the sample, through the objective lens. A dichroic mirror directs the excitation toward the objective and sample. The mirror must reflect wavelengths in the excitation range and pass the longer wavelengths of the emitted fluorescence. In fluorescence imaging, illumination intensity is typically 5 or 6 orders of magnitude greater than emitted fluorescence, so it is crucial to filter out excitation photons as completely as possible. The dichroic mirror passes a substantial amount of green light, on the order of five percent. The barrier filter does a much better job of removing the green light, attenuating the excitation wavelengths by about 5 orders of magnitude. The barrier filter is essential for making crisp, high-contrast images. | ||
| − | In Assignment 3, you are going to make images using the fluorescent dye [https://www.thermofisher.com/us/en/home/life-science/cell-analysis/fluorophores/alexa-fluor-568.html Alexa Fluor 568], manufactured by ThermoFischer Scientific. The peak excitation wavelength for the dye is 568 nm (as you may have surmised from the name). | + | In Assignment 3, you are going to make images using the fluorescent dye [https://www.thermofisher.com/us/en/home/life-science/cell-analysis/fluorophores/alexa-fluor-568.html Alexa Fluor 568], manufactured by ThermoFischer Scientific. The peak excitation wavelength for the dye is 568 nm (as you may have surmised from the name). To excite this dye, you can either use a light source with a very narrow wavelength range (like a laser), or a broadband source (like an arc lamp or an LED) combined with an excitation filter (which effectively reduces the excitation light to a small range of wavelengths). We've chosen a high power Luxeon Rebel Lime LED as a light source (part number LXML-PX02-0000, [https://www.luxeonstar.com/assets/downloads/ds68.pdf data sheet available here]) to use as the excitation source for our microscope. LEDs are becoming more widely used in fluorescence microscopy in recent years because of the wide range of wavelengths available, and their relatively low cost. |
| − | + | ||
| − | + | ||
| − | + | ||
| − | + | ||
| − | + | ||
| − | + | ||
| − | + | ||
| − | + | ||
| − | + | ||
| − | + | ||
| − | + | ||
| − | + | ||
| − | + | ||
| − | + | ||
| − | + | ||
| − | + | ||
| − | + | ||
| − | + | ||
| − | + | ||
| − | + | ||
| + | ===LED epi-illuminator design=== | ||
| − | + | In contrast with the transilluminated bright-field approach where the LED incident light traverses the sample before reaching all image-forming optics, illumination for epi-fluorescence microscopy reaches the sample through the objective lens — from the same side of the sample that is observed. The rationale behind this design choice is the relative dimness of the fluorescence emission signal with respect to the needed excitation intensity (you will calculate this in a future Assignment). Even though fluorescence excitation and emission occur at distinct wavelengths and can thus be filtered away from one another, it is still advantageous to direct the very bright excitation light source away from the imaging system. | |
| − | + | Unlike a laser, which is typically collimated into a narrow beam of parallel rays, LED light sources are very divergent. In other words, light from an LED is emitted in a large range of angles. When building an LED illuminator, our first goal is to collect as much of this light as we possibly can and direct it towards our sample. The divergent nature of LEDs are already working against us, but by understanding some optics subtleties, we can overcome at least some of the hurdles. | |
| − | + | Here are some considerations that we'll use to design our illuminator: | |
| + | # Use a high NA lens to collect the most light from the LED. | ||
| + | #* The first thing we want to do is collimate the LED light - this is the purpose of L4 in the block diagram. How should we choose L4? In the real world, lenses have a finite diameter (unlike in ray tracing problems, where we assume the lenses extend forever!). If we choose a large focal length for our collimating lens, only a small portion of the light rays emanating from the LED would actually make it through (see figure below). Choosing a lens with a smaller focal length (assuming it has the same diameter) will result in more rays being collected. The light collecting power of a lens is called the ''Numerical Aperture'' or just: NA. It's defined as <math> NA = n \sin(\theta)</math> where ''n'' is the index of refraction of the medium surrounding the lens, and <math>\theta</math> is the angle of the most divergent ray that still makes it through the lens. | ||
| + | #* [[Image:HighVsLowNA.png|thumb|center|400px|Comparison of light collected from two lenses with the same diameter, but different focal lengths. The smaller focal length lens, which has a higher NA, collects more rays.]] | ||
| + | #* In addition to choosing a small focal length, we should also consider aberrations of our optical system. Spherical lenses work well under the small angle approximation. For our LED, the light is actually traveling at large enough angles that break this assumption, creating spherical aberrations. Using an ''aspherical'' lens we can reduce these aberrations and improve our light collecting abilities. | ||
| + | #* '''In the 20.309 lab, the best candidate lens for L4 is the ACL2520U from Thorlabs. It has a 20 mm focal length, and an NA of 0.6.''' | ||
| + | # Use an excitation tube lens to collimate light at the sample plane | ||
| + | #* With L4 in place, we now have collimated light. We're not done yet. Since we're using an epi-illumination configuration, the light will pass into our microscope and through the objective lens. Passing the collimated LED light directly into the objective lens would form an image of the LED element on the sample plane. This is not a good strategy - we want to have a uniform illumination profile at the sample. The solution to this is to add a second lens, L3, which we're going to call the "excitation tube lens". This lens will be used to focus the LED light onto the back focal plane of the objective, so that the light coming out of the objective will now be collimated onto the sample. | ||
| + | #* [[Image:MicroscopeEpiIlluminatorDiagram_L3.png|thumb|center|400px|Lens L3 (blue) focuses the LED light onto the back focal plane (BFP) of the objective. For ray tracing purposes, you can treat the objective as a single lens with focal length 200 mm / M, where M is the nominal magnification of the objective.]] | ||
| + | #* Choosing the focal length of L3 is (perhaps not surprisingly) also not arbitrary. Remember that the LED is an ''extended source''. The lens system you are implementing will make an image of this source at the focal plane of L3. The system we are setting up will then make an image of the LED on the BFP of the objective. But the objective, perhaps not surprisingly, is also not a lens that extends out to infinity. It is finite, specifically, it has a finite ''aperture''. Light hitting the objective beyond it's ''back aperture'' will effectively be blocked, and not continue through the optical system. So to collect the most light, we need to ensure that the image of the LED on the BFP is no larger than the objective's back aperture (see the following figure). | ||
| + | #* [[Image:LEDimageMagnification.png|thumb|center|800px|L3 creates an image of the LED on the back focal plane of the objective. If the magnification is too large, light will be blocked by the objective's back aperture.]] | ||
| + | #* Spacial constraints in your microscope prevent you from choosing just any focal length for L3. The C6W cage cube itself is 50 mm, placing a lower limit on the focal length of L3. After 50 mm, '''the next-largest available lens in the lab is 75 mm. Let's use this for L3.''' | ||
{{Template:Assignment Turn In|message= Design the illumination path of your fluorescence microscope. | {{Template:Assignment Turn In|message= Design the illumination path of your fluorescence microscope. | ||
| − | + | # Draw a block diagram of the LED epi-illuminaton path. Indicate the focal lengths of all lenses, the correct lens orientation, and all important distances between components. | |
| − | + | # Lenses L3 and L4 make an image of the LED. Assuming the initial size of the LED is 1.3 mm, what is the size of the LED image made by lens L3? | |
| − | + | }} | |
| − | + | ||
| − | + | ||
==References== | ==References== | ||
Latest revision as of 18:39, 12 September 2019

 |
|
|
|---|---|---|
|
|
|


Overview

The phenomenon of fluorescence has beguiled both sober and inebriated witnesses since at least the late sixteenth century. Some of the earliest observers noticed an unusual blue tint in water that had been infused with the wood of a Mexican tree called Coatli. Other naturally-occurring fluorescent and phosphorescent materials such as Bologna Stone (baryte), fluorite, and quinine sparked considerable interest from some the most preeminent scientists in all of history. Galileo Galilei, Robert Boyle, David Brewster, John Herschel, and that trippy dude from your high school with all the black-light posters in his room all spent time contemplating the curious nature and simple beauty of fluorescence.

The brilliant physicist and mathemetician George Stokes conducted a particularly clever experiment in which he used a prism to separate sunlight into its component colors. As he moved a vial of quinine sulfate from color to color, Stokes noted that quinine fluoresces only when illuminated by ultraviolet light — the invisible part of the rainbow just beyond the majestic blue band. The vial of quinine did not glow when Stokes placed the it in any other part of the rainbow. Because ultraviolet illumination gave rise to blue light, Stokes concluded that fluorescent emission has a longer wavelength than the excitation. This observation turns out to be spot on, and in his honor the difference in wavelength between the excitation and emission peak a fluorophore's spectrum is called the Stokes shift.
Reconciling Stokes' observation with the prevailing theory of light at the time of Stokes' experiment proved to be extraordinarily difficult. The classical theory of electromagnetism was the best thing going at the time. In the classical theory, a more intense beam of light has a larger electric field. The classical theory suggested that intense light ought to excite a fluorescent sample. But Stokes observed that it was the color of the light instead of its intensity that mattered. Ultraviolet is the only color of light that excites quinine, regardless of how bright any other color is.[1] In order to explain Stokes' observation, Albert Einstein had to dream up a whole new model for how light works: the quantum theory. Einstein introduced the idea in one of his "miracle year" papers in 1905 with the dense title of Concerning an Heuristic Point of View Toward the Emission and Transformation of light. It's is a lovely paper, and you should definitely put it on your reading list. In the paper, Einstein posited that light is made out of discrete energy packets (which we now call photons).
The energy of a single photon depends only on its wavelength (color) and is given by the equation:
- $ E=h\nu=\frac{hc}{\lambda} $,
where ν is frequency, c is the speed of light, $ \lambda $ is wavelength and h is the Planck constant approximately equal to 6.626070040(81)×10−34 J⋅s. In Section 7 of Einstein's paper, he offered a persuasive theoretical argument for the correctness of Stokes' rule despite the fact that the mechanism of fluorescence was not known at the time: "If the fluorescent substance is not a perpetual source of energy, the principle of conservation of energy requires that the energy of an emitted energy quantum cannot be greater than of the incident light quantum.."[2]
Mechanism of fluorescence
The diagram below depicts the sequence of events that gives rise to fluorescence. The process begins with a molecule absorbing a photon. This increases the amount of energy stored in the molecule. Most of the energy goes into raising the energy level of an electron above its ground state. The remainder goes toward increasing the vibrational energy of the molecule. After absorbance, the molecule very rapidly sheds some of its energy through the processes of vibrational relaxation and internal conversion. Both of these processes convert some of the photon's energy to heat. After that, the molecule returns to its ground state by emitting a photon. Since some of the original photon's energy was lost to heat, the emitted photon has a longer wavelength (and hence lower energy) than the original one.

In 1933, Aleksander Jablonski published a simple diagram similar to the one below. The diagram shows the details of the energy transitions that that take place during fluorescence and phosphorescence. The vertical axis of the diagram represents total energy. Another implication of the quantum theory is that when electrons are confined to a space (for example, bound to a molecule), they can only occupy certain discrete energy levels. Allowable electronic energy levels are indicated by thick horizontal lines. The ground state of the molecule S0 appears at the bottom of the diagram. Two excited states are shown: S1 and S2. As energy increases, the difference in energy between states gets smaller. Fine horizontal lines above each electronic energy level represent energy stored in vibrational modes of the molecule. (Vibrational energy is also discrete.) Thus, each line represents a possible value for the sum of electronic and vibrational energy.

The possible energy states are grouped into two columns. Each column represents a different molecular spin state. The spin state depends on the number of unpaired up/down electron spins. Singlet states (denoted by the letter "S") have no unpaired spins while triplet states (denoted by "T") have two unpaired spins. Don't sweat the details too much. The bottom line is that transitions within a column are much more likely than transitions that cross columns. Fluorescence does not require an electron to change spin. It is a fast phenomenon that takes place entirely in the lefthand column. Phosphorescence involves an electron changing its spin. The probabilities of the transitions are much lower and hence phosphorescence occurs over a much longer timescale (up to hours).
It's not a coincidence that fluorescence takes place for the most part in visible wavelengths. The diagram below shows that single photons with wavelengths longer than about 700 nm have energies less than about 1.8 electron volts (2.88×10⁻¹⁹ J), which roughly corresponds to the energy range of vibrational modes of molecules. Visible photons (λ= 400 - 700 nm) have energies in the same range as the differences between in energy levels of electrons bound to a molecule. X-rays (0.01 - 10 nm) have higher energy — more than enough energy to completely remove an electron from a molecule instead of just exciting it to a higher energy state. Ultraviolet light bridges the gap.

Fluorescence microscope design
Excitation sources and optical filters

As shown in the block diagram, the major components required for fluorescence imaging are an illuminator (LED, excitation filter (EX), L3, and L4), dichroic mirror (DM), and emission filter (or barrier filter, BF). The illuminator provides light in the appropriate wavelength range to excite the fluorescent molecules in the sample. Fluorescence microscopes that use broadband light sources such as arc lamps and LEDs require an excitation filter to limit the wavelengths in the illumination to the proper range. Fluorescence microscopes that use lasers don't require an excitation filter because lasers emit a very narrow range of wavelengths.

Excitation light comes from beneath the sample, through the objective lens. A dichroic mirror directs the excitation toward the objective and sample. The mirror must reflect wavelengths in the excitation range and pass the longer wavelengths of the emitted fluorescence. In fluorescence imaging, illumination intensity is typically 5 or 6 orders of magnitude greater than emitted fluorescence, so it is crucial to filter out excitation photons as completely as possible. The dichroic mirror passes a substantial amount of green light, on the order of five percent. The barrier filter does a much better job of removing the green light, attenuating the excitation wavelengths by about 5 orders of magnitude. The barrier filter is essential for making crisp, high-contrast images.
In Assignment 3, you are going to make images using the fluorescent dye Alexa Fluor 568, manufactured by ThermoFischer Scientific. The peak excitation wavelength for the dye is 568 nm (as you may have surmised from the name). To excite this dye, you can either use a light source with a very narrow wavelength range (like a laser), or a broadband source (like an arc lamp or an LED) combined with an excitation filter (which effectively reduces the excitation light to a small range of wavelengths). We've chosen a high power Luxeon Rebel Lime LED as a light source (part number LXML-PX02-0000, data sheet available here) to use as the excitation source for our microscope. LEDs are becoming more widely used in fluorescence microscopy in recent years because of the wide range of wavelengths available, and their relatively low cost.
LED epi-illuminator design
In contrast with the transilluminated bright-field approach where the LED incident light traverses the sample before reaching all image-forming optics, illumination for epi-fluorescence microscopy reaches the sample through the objective lens — from the same side of the sample that is observed. The rationale behind this design choice is the relative dimness of the fluorescence emission signal with respect to the needed excitation intensity (you will calculate this in a future Assignment). Even though fluorescence excitation and emission occur at distinct wavelengths and can thus be filtered away from one another, it is still advantageous to direct the very bright excitation light source away from the imaging system.
Unlike a laser, which is typically collimated into a narrow beam of parallel rays, LED light sources are very divergent. In other words, light from an LED is emitted in a large range of angles. When building an LED illuminator, our first goal is to collect as much of this light as we possibly can and direct it towards our sample. The divergent nature of LEDs are already working against us, but by understanding some optics subtleties, we can overcome at least some of the hurdles.
Here are some considerations that we'll use to design our illuminator:
- Use a high NA lens to collect the most light from the LED.
- The first thing we want to do is collimate the LED light - this is the purpose of L4 in the block diagram. How should we choose L4? In the real world, lenses have a finite diameter (unlike in ray tracing problems, where we assume the lenses extend forever!). If we choose a large focal length for our collimating lens, only a small portion of the light rays emanating from the LED would actually make it through (see figure below). Choosing a lens with a smaller focal length (assuming it has the same diameter) will result in more rays being collected. The light collecting power of a lens is called the Numerical Aperture or just: NA. It's defined as $ NA = n \sin(\theta) $ where n is the index of refraction of the medium surrounding the lens, and $ \theta $ is the angle of the most divergent ray that still makes it through the lens.
-
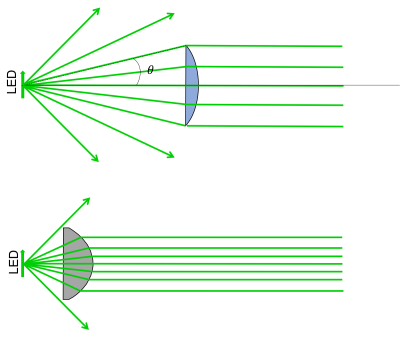 Comparison of light collected from two lenses with the same diameter, but different focal lengths. The smaller focal length lens, which has a higher NA, collects more rays.
- In addition to choosing a small focal length, we should also consider aberrations of our optical system. Spherical lenses work well under the small angle approximation. For our LED, the light is actually traveling at large enough angles that break this assumption, creating spherical aberrations. Using an aspherical lens we can reduce these aberrations and improve our light collecting abilities.
- In the 20.309 lab, the best candidate lens for L4 is the ACL2520U from Thorlabs. It has a 20 mm focal length, and an NA of 0.6.
- Use an excitation tube lens to collimate light at the sample plane
- With L4 in place, we now have collimated light. We're not done yet. Since we're using an epi-illumination configuration, the light will pass into our microscope and through the objective lens. Passing the collimated LED light directly into the objective lens would form an image of the LED element on the sample plane. This is not a good strategy - we want to have a uniform illumination profile at the sample. The solution to this is to add a second lens, L3, which we're going to call the "excitation tube lens". This lens will be used to focus the LED light onto the back focal plane of the objective, so that the light coming out of the objective will now be collimated onto the sample.
-
 Lens L3 (blue) focuses the LED light onto the back focal plane (BFP) of the objective. For ray tracing purposes, you can treat the objective as a single lens with focal length 200 mm / M, where M is the nominal magnification of the objective.
 - Choosing the focal length of L3 is (perhaps not surprisingly) also not arbitrary. Remember that the LED is an extended source. The lens system you are implementing will make an image of this source at the focal plane of L3. The system we are setting up will then make an image of the LED on the BFP of the objective. But the objective, perhaps not surprisingly, is also not a lens that extends out to infinity. It is finite, specifically, it has a finite aperture. Light hitting the objective beyond it's back aperture will effectively be blocked, and not continue through the optical system. So to collect the most light, we need to ensure that the image of the LED on the BFP is no larger than the objective's back aperture (see the following figure).
-
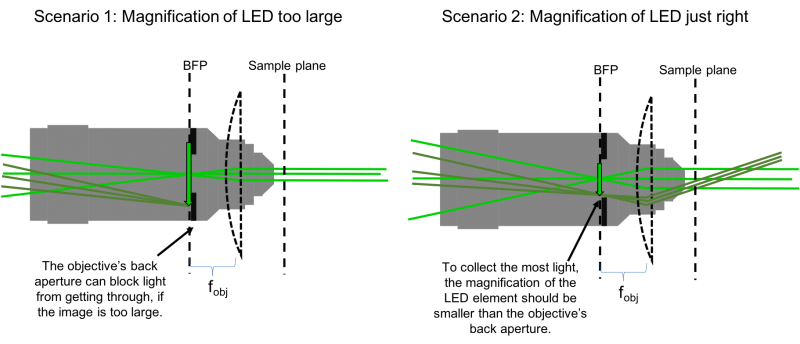 L3 creates an image of the LED on the back focal plane of the objective. If the magnification is too large, light will be blocked by the objective's back aperture.
 - Spacial constraints in your microscope prevent you from choosing just any focal length for L3. The C6W cage cube itself is 50 mm, placing a lower limit on the focal length of L3. After 50 mm, the next-largest available lens in the lab is 75 mm. Let's use this for L3.


| |
Design the illumination path of your fluorescence microscope.
|
References
- ↑ This is not perfectly true. We will talk about two-photon excitation later on.
- ↑ http://www.colorado.edu/physics/phys2170/phys2170_sp15/Library_files/A.%20Einstein,%20Ann.%20Phys.%2017,%20132%201905.pdf
- Overview
- Part 1: Noise in images
- Part 2: Fluorescence microscopy
- Part 3: Build an epi-illuminator for your microscope
Back to 20.309 Main Page