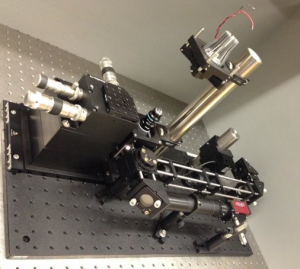
Assignment 1 Overview: Transillumination microscopy
Introduction
Over the next few weeks, you will build an optical microscope using lenses, mirrors, filters, optical mounts, CCD cameras, lasers, and other components in the lab. The work is divided into 5 assignments. Each assignment requires some problem solving, some lab work, some analysis, lots of clear thinking, and an individually written answer sheet turned in on Stellar. All of the items you are expected to turn in are indicated by a pencil symbol in the lab manual.
| |
This symbol means that you have to turn something in. |
Background reading and resources
You will work with log-log plots in this assignment and future ones. These seem to confuse everybody. Read this page to remind yourself how log-log plots work.
Several microscope manufacturers maintain educational websites, including Nikon's MicroscopyU, Olympus' Microscopy Primer, and the Zeiss online microscopy campus. The content on these sites ranges from basic concepts like Snell's law and Resolution to advanced techniques like supper resolution imaging.
Assignment details
This assignment has 4 parts:
- Part 1: Learn about optics and answer a few questions to answer before you start your lab work;
- Part 2: Some warm-up lab exercises;
- Part 3: You will build a microscope; and finally you will
- Part 4: Measure its magnification and the size of some small beads.
You will add fluorescence capability in the next part of the lab.
Submit your work in on Stellar in a single PDF file with the naming convention <Lastname><Firstname>Assignment1.pdf. Here is a checklist of all things you have to turn in:
| |
Make sure to include answers to all the following questions: Part 1 (individually):
Part 2 (individually):
Parts 3 and 4 (as a team):
Note: Parts 1 and 2 will amount to 60% of your grade; parts 3 and 4 to 40%. |
- Overview
- Part 1: Pre-lab questions
- Part 2: Optics bootcamp
- Part 3: Build a microscope
- Part 4: Measure stuff
Back to 20.309 Main Page
References

