Difference between revisions of "20.109(F23):M2D4"
Noreen Lyell (Talk | contribs) (→Protocols) |
Noreen Lyell (Talk | contribs) (→Protocols) |
||
| Line 17: | Line 17: | ||
==Protocols== | ==Protocols== | ||
| − | ===Part 1: | + | ===Part 1: Align KBP12 and PfFKBP35 protein sequences=== |
| − | + | One way to compare proteins is to align the amino acid sequences. | |
| − | = | + | #To start, you will use the align function in UniProt (linked [https://www.uniprot.org/align here]). |
| + | #Open the word document (linked [[Media:Fa22 AA sequence FKBP35 FKBP12.docx|here]]), then copy all of the text within the document and paste into second box under the header "Enter multiple protein or nucleotide sequences, separated by a FASTA header." | ||
| + | #Select the 'Run Align' button at the bottom right of the page. | ||
| + | #When the alignment is finished, click on 'Completed' under the 'Status' header. | ||
| + | #Review your alignment results by selecting each of the tabs across the top of the page. | ||
| + | #*The 'Overview' tab shows the exact matches between the sequences in purple boxes. | ||
| + | #*The 'Trees' tab shows evolutionary relationships between the sequences by representing the species on branches with varying distances This is more informative when more than two sequences are aligned. | ||
| + | #*The 'Percent Identity Matrix' tab provides a numeric score determined for each pair of aligned sequences displayed in a matrix. It measures the number of identical residues (or matched) in relation to the length of the alignment. | ||
| + | #*The 'Text Output' tabs shows the alignment with information regarding the degree of conservation at each amino acid. An * (asterisk) indicates positions which have a single, fully conserved residue. A : (colon) indicates conservation between groups of strongly similar properties. And a . (period) indicates conservation between groups of weakly similar properties. | ||
| + | #<font color = #4a9152 >'''In your laboratory notebook,'''</font color> complete the following: | ||
| + | #*Record the information provided in each of the tabs. | ||
| + | #*Briefly, describe the similarities and differences you notice by examining the amino acid sequences of FKBP12 and PfFKBP35. | ||
| + | #*What regions might be interesting targets to target with a small molecule specifically designed to bind PfFKBP35? Why? | ||
| + | #*What type of functional group can be used to target the region? (a positive functional group? a polar functional group?). | ||
| − | + | ===Part 2: Examine KBP12 and PfKBP35 structures=== | |
| − | + | Because it is difficult to gather information regarding secondary and tertiary structure from an amino acid sequence, it is often more informative to evaluate 3D models of proteins. For this exercise you will use protein viewing platforms to examine the structures of FKBP12 and PfFKBP35. | |
| − | + | ||
| − | + | ||
| − | + | ||
| − | + | ||
| − | + | ||
| − | + | ||
| − | + | ||
| − | + | ||
| − | + | ||
| − | + | ||
| − | + | ||
| − | + | ||
| − | + | ||
| − | + | ||
| − | + | ||
| − | + | ||
| − | + | ||
| − | + | ||
| − | + | ||
| − | + | ||
| − | + | ||
| − | + | ||
| − | + | ||
| − | + | ||
| − | + | ||
| − | + | ||
| − | + | ||
| − | + | ||
| − | + | ||
| − | + | ||
| − | + | ||
| − | + | ||
| − | + | ||
| − | + | ||
| − | + | ||
| − | + | ||
| − | + | ||
| − | + | ||
| − | ==== | + | #To start, you will examine the structure of FKBP12 using the Protein Data Bank (PDB) (linked [http://www.pdb.org/pdb/home/home.do here]). In this online database, the structures are organized according to PDB identification codes. |
| + | #For this exercise, you will look at the unbound form of FKBP12. | ||
| + | #*Enter "1D6O" into the search box at the top right corner of the PDB homepage. | ||
| + | #The landing page for the FKBP12 structure includes background information on the source and reference for this protein structure. | ||
| + | #<font color = #4a9152 >'''In your laboratory notebook,'''</font color> complete the following: | ||
| + | #*What method was used to solve this protein structure? Perform a quick search to learn more about this method and provide a brief description. | ||
| + | #*At what resolution was the structure solved? Perform a quick search to learn more about this concept and provide a brief description. | ||
| + | #*What is the total weight of the structure? | ||
| + | #*How many chains are included in this structure? | ||
| + | #*Read the abstract for the reference article wherein this structure was first published. What is the difference noted between the solved structures associated with this work when different ligands are bound? | ||
| + | #Under the structure shown on the left side of the window, click the 'Structure' link. A page showing the 'cartoon' structure of FKBP12 will load. Using the tools to the right of this page you will be able to more closely examine the structure. | ||
| + | #First, let's orient ourselves on how to move / manipulate the protein structure. | ||
| + | #*Place your cursor over the structure and while pressing down on your mouse / track pad, move the image to view the protein structure from different angles. | ||
| + | #*To zoom-in on an area of the protein structure, place your cursor on the area of interest and double-click. When zoomed in single-click on a residue to get a more detailed view of the amino acids that are present in that area. The dotted lines represent bonds or salt bridges that exist between the elements in the amino acids. | ||
| + | #*To zoom-out, single-click on the white space in the viewer window. | ||
| + | #*To zoom-in or -out more gradually, use two fingers and drag in the up or down direction. | ||
| + | #*[[Image:Fa22 M2D7 PDB amino acid location.png|thumb|400px|right|]]To identify which amino acid residues are present in each position of the protein, hover your cursor over the protein. A box will appear in the lower right of the viewer window (see example to the right). Though most of the details here can be ignored, the information provided tells you that the highlighted residue is a alanine (Ala) at position 72 in the amino acid sequence. | ||
| + | #<font color = #4a9152 >'''In your laboratory notebook,'''</font color> complete the following: | ||
| + | #*What secondary structures are present in FKBP12? | ||
| + | #Next, let's consider the tools provided in the panel on the right of the page. | ||
| + | #The contents of the 'Components' tab are listed: Polymer, Ligand, Water, and Ion. | ||
| + | #*Polymer refers the larger structures present, such as protein chains, DNA, or RNA. | ||
| + | #*Ligand refers to any non-polymer structure, such as ligand binders, ATP, or co-factors that are not single atoms. | ||
| + | #*Water refers to water. | ||
| + | #*Ion refers to any lone elements that are associated with the structure. | ||
| + | #*Use the 'eyeball' icon to the right of the component labels to remove / add the components to the image. | ||
| + | #<font color = #4a9152 >'''In your laboratory notebook,'''</font color> complete the following: | ||
| + | #*Does the FKBP12 structure contain the Components listed? Answer yes or no for each Component type. | ||
| + | #Click on the 'Density' tab. Though we will not focus much on the details here, the electron density map is the actual data from the x-ray crystallography experiment used to solve the structure. | ||
| + | #*Select '2Fo-Fc σ' from the options. | ||
| + | #*Click the box to the right of 'Wireframe' such that this feature is activated (toggle to '✓ On'). | ||
| + | #*Click on a residue within the protein structure. This will zoom-in on that area and also layer a grid, or cage, over the area. The cage represents the electron density data that were captured via x-ray crystallography. The structural features and atoms within the FKBP12 protein were modeled to match the density map, thus providing a best estimate of the protein structure. The resolution is related to how tight this cage is to the solved structure. Though a gross oversimplification, the relationship can be described as such: the fit of the cage to the solved structure is related to the angstrom value achieved via crystallography, the smaller the angstrom the better the resolution and thus the tighter the cage to the solved structure. | ||
| + | #To gain more insight into the secondary structure of FKBP12, select the 'Sequence' tab above the protein window. | ||
| + | #The exact positions for several different structural features are provided in the chart on this tab. | ||
| + | #<font color = #4a9152 >'''In your laboratory notebook,'''</font color> complete the following: | ||
| + | #*What secondary structures are present in FKBP12? | ||
| + | #*At what amino acid positions are these secondary structures present? | ||
| + | #Next, let's look at the structure of PfFKBP35! | ||
| + | #Though the structure of FKBP12 was solved experimentally, this is not true for the full-length version of PfFKBP35. Therefore, we will use AlphaFold Protein Structure Database to examine the structure of PfFKBP35 (linked [https://alphafold.ebi.ac.uk/ here]). With this software, you will look at the predicted structure of PfFKBP35. | ||
| + | #*Enter "Q8I4V8" into the search box at the center of the AlphaFold Protein Structure Database homepage. | ||
| + | #Choose the first entry, "Peptidyl-prolyl cis-trans isomerase FKBP35" from the options listed. | ||
| + | #The landing page for the PfFKBP35 structure includes background information on the biological function and the references for this information. | ||
| + | #<font color = #4a9152 >'''In your laboratory notebook,'''</font color> complete the following: | ||
| + | #*What is the biological function of PfFKBP35? | ||
| + | #Scroll to the predicted structure of PfFKBP35. | ||
| + | #Familiarize yourself with how to move / manipulate the structure. The movements / manipulations are largely the same as those used in PDB. | ||
| + | #Though the information that can be gained from the predicted structure of PfFKBP35 is limited compared to the experimentally derived structure of FKBP12, several questions can be answered by visually examining the predicted structure. | ||
| + | #<font color = #4a9152 >'''In your laboratory notebook,'''</font color> complete the following: | ||
| + | #*What secondary structures are present in PfFKBP35? | ||
| + | #*At what amino acid positions are these secondary structures present? (Note: this can be found by moving the cursor over the area of interest in the protein structure.) How does this compare to FKBP12? | ||
| + | #*Briefly, describe the similarities and differences you notice by visually examining the structures of FKBP12 and PfFKBP35. | ||
| − | + | ===Part 3: Align FKBP12 and PfFKBP35 protein structures=== | |
| − | and | + | |
| − | + | Though it is possible to identify differences via a visual inspection of two proteins side-by-side, an overlay of two proteins can better highlight areas of interest that are specific to each protein or shared between the proteins. | |
| − | + | #To start, you will need to download a trial version of PyMOL (linked [https://pymol.org/2/ here]). | |
| + | #You will also need to download the PDB files for FKBP12 and PfFKBP35. | ||
| + | #*For FKBP12: Toward the top, right of the protein structure page click the 'Download Files' dropdown and select 'PDB Format' from the options listed. | ||
| + | #*For PfFKBP35: Toward the top, left of the protein structure page click the 'PDB File' button to the right of the 'Download' header. | ||
| + | #Open PyMOL. | ||
| + | #*Select the 'Skip Activation' option. | ||
| + | #[[Image:Fa22 M2D7 file upload.png|right|thumb|200px]]To open the .pdb files, be sure that the PyMOL window active then select 'File' from the toolbar and choose 'Open...' from the dropdown list. Select each file. | ||
| + | #*Files should populate the panel to the right of the PyMOL window (see image to the right). | ||
| + | #For technical reasons due to the data embedded in the .pdb file for FKBP12 that are beyond the scope of this exercise, two chains will appear in the structure viewing panel. To omit the second chain, enter the following as separate commands: | ||
| + | #* "create 1d6o_1_chain, 1d6o and chain A" | ||
| + | #* "hide everything, 1d6o" | ||
| + | #To align the structures, enter the command: "align 1d6o_1_chain,AF-Q8I4V8-F1-model_V4" | ||
| + | #If the aligned structures are out of the viewing panel, enter the command: "zoom AF-Q8I4V8-F1-model_V4" | ||
| + | #[[Image:Fa22 M2D7 color selection.png|right|thumb|200px]]If the default color-coding make it difficult to distinguish the aligned proteins, select the 'C' (C = color) next to the name of one of the protein files in the panel to the right of the PyMOL window and select one of the color options from the dropdown list (see image to the right). | ||
| + | #Visually inspect the alignment by moving / manipulating the structures. | ||
| + | #<font color = #4a9152 >'''In your laboratory notebook,'''</font color> complete the following: | ||
| + | #*Briefly, describe your observations. Do the proteins appear to align well? Not well? Perhaps a combination of well and not well? | ||
| + | #To better visualize the the structures you can use the options in the 'S' (S = show) next to the files of the proteins in the panel to the right. | ||
| + | #*The options include changing the structure such that it is represented as sticks or dots. | ||
| + | #*Options can be applied to only one structure by selecting the 'S' to the right of the specific protein file or to both structures by selecting the 'S' to the right of the 'all' file. | ||
| + | #To identify the amino acid residues present at a specific location within the structures, double-click on an area. The amino acid at that position will be provided in the top panel of the PyMOL window (see image below).[[Image:Fa22 M2D7 amino acid identification.png|center|thumb|450px]] | ||
| + | #<font color = #4a9152 >'''In your laboratory notebook,'''</font color> complete the following: | ||
| + | #*Based on what you learned from the protein structures, consider how you might design a small molecule specific to PfFKBP35: | ||
| + | #**What regions might be interesting targets to target with a small molecule specifically designed to bind PfFKBP35? Why? | ||
| + | #**What type of functional group can be used to target the region? (a positive functional group? a polar functional group?). | ||
| + | #*Are the regions identified here the same as those identified in Part #2? Different? | ||
| + | #*Comment on which approach is most useful (either examining amino acid sequences or structures) in identifying regions that are unique to each protein or shared between both proteins. Why? | ||
| − | + | ===Part 4: Visually evaluate chemical structures of putative binders=== | |
| − | + | ||
| − | + | ||
| − | + | ||
| − | + | ||
| − | + | ||
| − | + | ||
| − | + | ||
| − | + | ||
| − | + | ||
| − | + | ||
| − | + | ||
| − | + | ||
| − | + | ||
| − | + | ||
| − | + | ||
| − | + | ||
| − | + | ||
| − | + | ||
| − | + | ||
| − | + | ||
| − | + | ||
| − | + | ||
| − | + | ||
| − | + | ||
| − | + | ||
| − | + | ||
| − | + | ||
| − | + | ||
| − | + | ||
| − | ===Part | + | |
Following the use SMM technology to complete an initial screen for putative binders, the small molecules identified as positive hits are then confirmed using functional assays. You will use the PfFKBP35 protein you purified in the next laboratory session to perform a differential scanning fluorimetry (DSF) assay. The DSF assay more directly tests binding between a small molecule and a protein target. In preparation for the DSF experiment, today you will review the structures of the small molecules below and select which you will test using the DSF assay. | Following the use SMM technology to complete an initial screen for putative binders, the small molecules identified as positive hits are then confirmed using functional assays. You will use the PfFKBP35 protein you purified in the next laboratory session to perform a differential scanning fluorimetry (DSF) assay. The DSF assay more directly tests binding between a small molecule and a protein target. In preparation for the DSF experiment, today you will review the structures of the small molecules below and select which you will test using the DSF assay. | ||
| Line 111: | Line 131: | ||
[[Image:Sp17 20.109 M1D7 chemical structure features.png|thumb|750px|center|]] | [[Image:Sp17 20.109 M1D7 chemical structure features.png|thumb|750px|center|]] | ||
| − | |||
With your partner, review the hits that were identified for PfFKBP35 (see table below). To see the chemical structures, translate the SMILES strings using one of the methods described in the text below the table. It may be easier to copy / paste the small molecule images into a powerpoint file so you can readily see all of the structures. Also, it may be helpful to use a color-coding system (like the one in the image provided above) to highlight features / structures that are common to the small molecules that putatively bind PfFKBP35. | With your partner, review the hits that were identified for PfFKBP35 (see table below). To see the chemical structures, translate the SMILES strings using one of the methods described in the text below the table. It may be easier to copy / paste the small molecule images into a powerpoint file so you can readily see all of the structures. Also, it may be helpful to use a color-coding system (like the one in the image provided above) to highlight features / structures that are common to the small molecules that putatively bind PfFKBP35. | ||
Revision as of 20:04, 17 October 2023

Contents
Introduction
A small molecule microarray (SMM) requires the covalent attachment of a library of small molecules to a glass slide. Our library is meant to broadly sample the drug-like chemical space (i.e. all possible chemical structures that have drug-like physical properties) and contains about 50,000 small molecules. Some libraries are much smaller, while many pharmaceutical companies possess high-throughput screening (HTS) collections of millions of compounds. Because this chemical space is very large, it’s difficult to generalize any single chemical reaction for this attachment that can be applied to all small molecules. We take a “one-size-fits-most” approach, where the glass slide is functionalized with a broadly reactive electrophile capable of reacting with nucleophiles present in most drug-like small molecules, such as alcohols or amines. Many small molecules contain multiple nucleophiles suitable for attachment. In this case, our manufacturing will result in a mixture of attachment sites. It’s important to remember that attachment to the glass slide constrains the possible orientation of the protein-small molecule interaction; some orientations are not possible because the glass slide and linker are in the way.
We start with a glass slide with exposed amines across the surface and attach a short PEG (polyethylene glycol) linker. To the end of this PEG linker, an isocyanate group is attached. Isocyanate, or R-N=C=O, is a resonant structure, and a partial positive charge is stabilized on the carbon atom. This carbon atom is electrophilic, and small molecules with nucleophiles will react here. We estimate that about 70% of drug-like small molecules are amenable to this reaction, and our library is filtered to contain only these molecules.

Our compound library is dissolved in DMSO and stored in 384-well plates. To dispense the compounds onto our functionalized glass slide, a robotic arm with a set of 48 metal pins is used to transfer the compounds to the glass slide. Each metal pin has a small slit in the end, and capillary action is used to precisely withdraw and dispense consistent volumes. When the pins touch the glass slide, the compound in DMSO is dispensed into a small circle of approximately 160 micron in diameter. Each pin prints one compound in two different locations on each slide, and then the pins are washed in water and DMSO. This process is repeated for each compound, resulting in our final microarray. The microarray is divided into 48 subarrays, and each subarray corresponds to one pin and contains 256 discrete spots. Within each subarray, we print a set of fluorescent compounds in the shape of an ‘X’ so that we can precisely determine where each spot is printed. After the compounds react, we quench the surface so that no electrophiles remain. This results in our final microarray; a collection of approximately 12,000 discrete spots displaying one compound each.
(Written by Rob Wilson. For more information read Bradner, J. E., McPherson, O. M., and Koehler, A. N. (2006) A method for the covalent capture and screening of diverse small molecules in a microarray format. Nature Prot. 1:2344-2352. PMID: 17406478.)
Protocols
Part 1: Align KBP12 and PfFKBP35 protein sequences
One way to compare proteins is to align the amino acid sequences.
- To start, you will use the align function in UniProt (linked here).
- Open the word document (linked here), then copy all of the text within the document and paste into second box under the header "Enter multiple protein or nucleotide sequences, separated by a FASTA header."
- Select the 'Run Align' button at the bottom right of the page.
- When the alignment is finished, click on 'Completed' under the 'Status' header.
- Review your alignment results by selecting each of the tabs across the top of the page.
- The 'Overview' tab shows the exact matches between the sequences in purple boxes.
- The 'Trees' tab shows evolutionary relationships between the sequences by representing the species on branches with varying distances This is more informative when more than two sequences are aligned.
- The 'Percent Identity Matrix' tab provides a numeric score determined for each pair of aligned sequences displayed in a matrix. It measures the number of identical residues (or matched) in relation to the length of the alignment.
- The 'Text Output' tabs shows the alignment with information regarding the degree of conservation at each amino acid. An * (asterisk) indicates positions which have a single, fully conserved residue. A : (colon) indicates conservation between groups of strongly similar properties. And a . (period) indicates conservation between groups of weakly similar properties.
- In your laboratory notebook, complete the following:
- Record the information provided in each of the tabs.
- Briefly, describe the similarities and differences you notice by examining the amino acid sequences of FKBP12 and PfFKBP35.
- What regions might be interesting targets to target with a small molecule specifically designed to bind PfFKBP35? Why?
- What type of functional group can be used to target the region? (a positive functional group? a polar functional group?).
Part 2: Examine KBP12 and PfKBP35 structures
Because it is difficult to gather information regarding secondary and tertiary structure from an amino acid sequence, it is often more informative to evaluate 3D models of proteins. For this exercise you will use protein viewing platforms to examine the structures of FKBP12 and PfFKBP35.
- To start, you will examine the structure of FKBP12 using the Protein Data Bank (PDB) (linked here). In this online database, the structures are organized according to PDB identification codes.
- For this exercise, you will look at the unbound form of FKBP12.
- Enter "1D6O" into the search box at the top right corner of the PDB homepage.
- The landing page for the FKBP12 structure includes background information on the source and reference for this protein structure.
- In your laboratory notebook, complete the following:
- What method was used to solve this protein structure? Perform a quick search to learn more about this method and provide a brief description.
- At what resolution was the structure solved? Perform a quick search to learn more about this concept and provide a brief description.
- What is the total weight of the structure?
- How many chains are included in this structure?
- Read the abstract for the reference article wherein this structure was first published. What is the difference noted between the solved structures associated with this work when different ligands are bound?
- Under the structure shown on the left side of the window, click the 'Structure' link. A page showing the 'cartoon' structure of FKBP12 will load. Using the tools to the right of this page you will be able to more closely examine the structure.
- First, let's orient ourselves on how to move / manipulate the protein structure.
- Place your cursor over the structure and while pressing down on your mouse / track pad, move the image to view the protein structure from different angles.
- To zoom-in on an area of the protein structure, place your cursor on the area of interest and double-click. When zoomed in single-click on a residue to get a more detailed view of the amino acids that are present in that area. The dotted lines represent bonds or salt bridges that exist between the elements in the amino acids.
- To zoom-out, single-click on the white space in the viewer window.
- To zoom-in or -out more gradually, use two fingers and drag in the up or down direction.
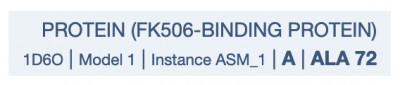
- To identify which amino acid residues are present in each position of the protein, hover your cursor over the protein. A box will appear in the lower right of the viewer window (see example to the right). Though most of the details here can be ignored, the information provided tells you that the highlighted residue is a alanine (Ala) at position 72 in the amino acid sequence.

- In your laboratory notebook, complete the following:
- What secondary structures are present in FKBP12?
- Next, let's consider the tools provided in the panel on the right of the page.
- The contents of the 'Components' tab are listed: Polymer, Ligand, Water, and Ion.
- Polymer refers the larger structures present, such as protein chains, DNA, or RNA.
- Ligand refers to any non-polymer structure, such as ligand binders, ATP, or co-factors that are not single atoms.
- Water refers to water.
- Ion refers to any lone elements that are associated with the structure.
- Use the 'eyeball' icon to the right of the component labels to remove / add the components to the image.
- In your laboratory notebook, complete the following:
- Does the FKBP12 structure contain the Components listed? Answer yes or no for each Component type.
- Click on the 'Density' tab. Though we will not focus much on the details here, the electron density map is the actual data from the x-ray crystallography experiment used to solve the structure.
- Select '2Fo-Fc σ' from the options.
- Click the box to the right of 'Wireframe' such that this feature is activated (toggle to '✓ On').
- Click on a residue within the protein structure. This will zoom-in on that area and also layer a grid, or cage, over the area. The cage represents the electron density data that were captured via x-ray crystallography. The structural features and atoms within the FKBP12 protein were modeled to match the density map, thus providing a best estimate of the protein structure. The resolution is related to how tight this cage is to the solved structure. Though a gross oversimplification, the relationship can be described as such: the fit of the cage to the solved structure is related to the angstrom value achieved via crystallography, the smaller the angstrom the better the resolution and thus the tighter the cage to the solved structure.
- To gain more insight into the secondary structure of FKBP12, select the 'Sequence' tab above the protein window.
- The exact positions for several different structural features are provided in the chart on this tab.
- In your laboratory notebook, complete the following:
- What secondary structures are present in FKBP12?
- At what amino acid positions are these secondary structures present?
- Next, let's look at the structure of PfFKBP35!
- Though the structure of FKBP12 was solved experimentally, this is not true for the full-length version of PfFKBP35. Therefore, we will use AlphaFold Protein Structure Database to examine the structure of PfFKBP35 (linked here). With this software, you will look at the predicted structure of PfFKBP35.
- Enter "Q8I4V8" into the search box at the center of the AlphaFold Protein Structure Database homepage.
- Choose the first entry, "Peptidyl-prolyl cis-trans isomerase FKBP35" from the options listed.
- The landing page for the PfFKBP35 structure includes background information on the biological function and the references for this information.
- In your laboratory notebook, complete the following:
- What is the biological function of PfFKBP35?
- Scroll to the predicted structure of PfFKBP35.
- Familiarize yourself with how to move / manipulate the structure. The movements / manipulations are largely the same as those used in PDB.
- Though the information that can be gained from the predicted structure of PfFKBP35 is limited compared to the experimentally derived structure of FKBP12, several questions can be answered by visually examining the predicted structure.
- In your laboratory notebook, complete the following:
- What secondary structures are present in PfFKBP35?
- At what amino acid positions are these secondary structures present? (Note: this can be found by moving the cursor over the area of interest in the protein structure.) How does this compare to FKBP12?
- Briefly, describe the similarities and differences you notice by visually examining the structures of FKBP12 and PfFKBP35.

Part 3: Align FKBP12 and PfFKBP35 protein structures
Though it is possible to identify differences via a visual inspection of two proteins side-by-side, an overlay of two proteins can better highlight areas of interest that are specific to each protein or shared between the proteins.
- To start, you will need to download a trial version of PyMOL (linked here).
- You will also need to download the PDB files for FKBP12 and PfFKBP35.
- For FKBP12: Toward the top, right of the protein structure page click the 'Download Files' dropdown and select 'PDB Format' from the options listed.
- For PfFKBP35: Toward the top, left of the protein structure page click the 'PDB File' button to the right of the 'Download' header.
- Open PyMOL.
- Select the 'Skip Activation' option.
- To open the .pdb files, be sure that the PyMOL window active then select 'File' from the toolbar and choose 'Open...' from the dropdown list. Select each file.
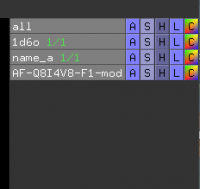
- Files should populate the panel to the right of the PyMOL window (see image to the right).
- For technical reasons due to the data embedded in the .pdb file for FKBP12 that are beyond the scope of this exercise, two chains will appear in the structure viewing panel. To omit the second chain, enter the following as separate commands:
- "create 1d6o_1_chain, 1d6o and chain A"
- "hide everything, 1d6o"
- To align the structures, enter the command: "align 1d6o_1_chain,AF-Q8I4V8-F1-model_V4"
- If the aligned structures are out of the viewing panel, enter the command: "zoom AF-Q8I4V8-F1-model_V4"
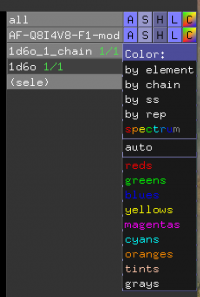
- If the default color-coding make it difficult to distinguish the aligned proteins, select the 'C' (C = color) next to the name of one of the protein files in the panel to the right of the PyMOL window and select one of the color options from the dropdown list (see image to the right).
- Visually inspect the alignment by moving / manipulating the structures.
- In your laboratory notebook, complete the following:
- Briefly, describe your observations. Do the proteins appear to align well? Not well? Perhaps a combination of well and not well?
- To better visualize the the structures you can use the options in the 'S' (S = show) next to the files of the proteins in the panel to the right.
- The options include changing the structure such that it is represented as sticks or dots.
- Options can be applied to only one structure by selecting the 'S' to the right of the specific protein file or to both structures by selecting the 'S' to the right of the 'all' file.
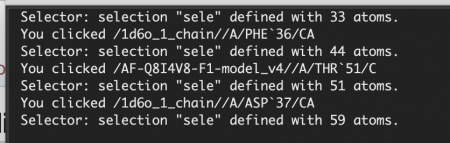
- To identify the amino acid residues present at a specific location within the structures, double-click on an area. The amino acid at that position will be provided in the top panel of the PyMOL window (see image below).
- In your laboratory notebook, complete the following:
- Based on what you learned from the protein structures, consider how you might design a small molecule specific to PfFKBP35:
- What regions might be interesting targets to target with a small molecule specifically designed to bind PfFKBP35? Why?
- What type of functional group can be used to target the region? (a positive functional group? a polar functional group?).
- Are the regions identified here the same as those identified in Part #2? Different?
- Comment on which approach is most useful (either examining amino acid sequences or structures) in identifying regions that are unique to each protein or shared between both proteins. Why?
- Based on what you learned from the protein structures, consider how you might design a small molecule specific to PfFKBP35:


Part 4: Visually evaluate chemical structures of putative binders
Following the use SMM technology to complete an initial screen for putative binders, the small molecules identified as positive hits are then confirmed using functional assays. You will use the PfFKBP35 protein you purified in the next laboratory session to perform a differential scanning fluorimetry (DSF) assay. The DSF assay more directly tests binding between a small molecule and a protein target. In preparation for the DSF experiment, today you will review the structures of the small molecules below and select which you will test using the DSF assay.
One method for assessing protein-small molecule binding is to visually inspect known small molecule binders for common features / structures. Your goal for today is to carefully examine the hits and identify any common features / structures. As in the example image below, it is possible that multiple features will be present within the same small molecule.

With your partner, review the hits that were identified for PfFKBP35 (see table below). To see the chemical structures, translate the SMILES strings using one of the methods described in the text below the table. It may be easier to copy / paste the small molecule images into a powerpoint file so you can readily see all of the structures. Also, it may be helpful to use a color-coding system (like the one in the image provided above) to highlight features / structures that are common to the small molecules that putatively bind PfFKBP35.
| Compound ID | SMILES |
| FK101 | C1CN(C2=CC=CC=C21)CCCNCC3(CCNC3)O |
| FK141 | O=C(C(C(C)(C)CC)=O)N1CCCC[C@H]1C(O[C@H](CCC2=CC=C(OC)C(OC)=C2)C3=CC(NC(C=C)=O)=CC=C3)=O |
| FK150 | O=C(C(C(C)(C)CC)=O)N1CCCC[C@H]1C(O[C@H](CCC2=CC=C(OC)C(OC)=C2)C3=CC(NC(CC)=O)=CC=C3)=O |
| FK169 | O=C(C(C(C)(C)CC)=O)N1CCCC[C@H]1C(O[C@H](CCC2=CC=C(OC)C(OC)=C2)C3=C(NC(C=C)=O)C=CC=C3)=O |
| FK189 | O=C(C(C(C)(C)COC(C=C)=O)=O)N1CCCC[C@H]1C(O[C@H](CCC2=CC=C(OC)C(OC)=C2)C3=CC=CC=C3)=O |
| FK201 | CC(=CCC/C(=C/CN1CC[C@H]([C@@H](C1)O)NC(=O)C2=CC=CC=N2)/C)C |
| FK296 | O=C(C(C(C)(C)COC(CC)=O)=O)N1CCCC[C@H]1C(O[C@H](CCC2=CC=C(OC)C(OC)=C2)C3=CC=CC=C3)=O |
| FK301 | COCCNC1=NC2=C(C=CN2)C(=C1)C3=NC=CC(=N3)N |
| FK401 | C1CCN(CC1)C[C@@H]2CN(C[C@@H]2CO)CC3=C(N=CC=C3)N |
| FK459 | O=C(C(C(C)(C)CNC(C=C)=O)=O)N1CCCC[C@H]1C(O[C@H](CCC2=CC=C(OC)C(OC)=C2)C3=CC=CC=C3)=O |
| FK502 | O=C(C(C(C)(C)CNC(CC)=O)=O)N1CCCC[C@H]1C(O[C@H](CCC2=CC=C(OC)C(OC)=C2)C3=CC=CC=C3)=O |
These online resources may be helpful to learning more about the hits identified in the SMM:
- Cloud version of ChemDraw here.
- Copy and paste the small molecule smiles into the work space to get a chemical structure
- Platform to transform the smiles information into a PubChem ID here.
- Copy and paste the smiles into the input ID search to determine the ID number.
- PubChem database of chemical information here.
- Includes small molecule molecular weight and other useful information.
In your laboratory notebook, complete the following:
- How many features did you identify that are present in two or more of the small molecules that putatively bind PfFKBP35? Are there more or less than you expected?
- Is there a feature present in all of the identified small molecules? What might this suggest about the binding site(s) and / or binding ability of PfFKBP35?
- Compare the features you identified to those present in the known binder, FK506 (SMILES: CC1CC(C2C(CC(C(O2)(C(=O)C(=O)N3CCCCC3C(=O)OC(C(C(CC(=O)C(C=C(C1)C)CC=C)O)C)C(=CC4CCC(C(C4)OC)O)C)O)C)OC)OC). Do any of the putative binders appear similar to FK506? Are the common features identified in your evaluation of the putative binders present in FK506?
- Rapamycin is also known to bind PfFKBP35 (SMILES: CC1CCC2CC(C(=CC=CC=CC(CC(C(=O)C(C(C(=CC(C(=O)CC(OC(=O)C3CCCCN3C(=O)C(=O)C1(O2)O)C(C)CC4CCC(C(C4)OC)O)C)C)O)OC)C)C)C)OC). Do any of the putative binders appear similar to rapamycin? Are the common features identified in your evaluation of the putative binders present in rapamycin?
- Can you assign the identified small molecules to sub-groups based on the common features that are present?
- What might the different features represent? More specifically, consider whether each subgroup has a unique binding site on the target protein or if each subgroup represents different solutions for interacting with the same binding site.
- How might you make modifications to the small molecules / features to probe binding? As a hint, consider how different functional groups could be positioned at a given site without altering qualitative binding in the SMM assay to translate that into some testable ideas (e.g. quantitative binding properties may be occurring that are functionally relevant, but not discernible by SMM assays; or such a site is not critical for binding and may allow for modifications that confer beneficial properties of the compound).
- Select five compounds to test using the DSF assay. Include your list in your notebook and email your list to your Instructor!
Reagents list
- small-molecule microarray slides (a gift from Koehler Laboratory)
- Tris-HCl buffered saline (TBS): 50 mM Tris-Hcl (pH = 7.5), 150 mM NaCl (from BioRad)
- TBS containing 0.1% Tween20 (TBS-T) (from BioRad)
- Alexa Fluor 647 anti-His antibody (from Qiagen)
Next day: Prepare protein for functional assay