Difference between revisions of "20.109(F21):M2D5"
Noreen Lyell (Talk | contribs) (→Reagent list) |
Becky Meyer (Talk | contribs) (→Part 2: Setup BLI assay) |
||
| (20 intermediate revisions by 2 users not shown) | |||
| Line 6: | Line 6: | ||
==Introduction== | ==Introduction== | ||
| − | + | To test the 'hits' that were identified in the SMM screen, you will perform a BioLayer Interferometry (BLI) experiment. The BLI assay is used to measure biomolecular interactions by assessing the interference pattern of white light. In this assay, a change in the number of molecules bound to a biosensor tip result in a shift in the interference pattern. These shifts can be measured in real-time. | |
| + | To measure biomolecular interactions, a layer of the protein of interest is immobilized on a biosensor tip. When the immobilized protein binds to ligand in a solution an increase in the optical thickness at the biosensor tip results in a wavelength shift. The shift is a direct measure of the change in thickness of the biological layer. Because the shift is caused by thickness of the biological layer at the biosensor tip, only the binding or dissociating of ligand generates an interference pattern. | ||
| − | + | To measure the thickness of the biological layer BLI uses fiber optic biosensors that have a proprietary biocompatible coating at the tip. The system that we will use is the Octet-RED96, which contains eight spectrophotometers. The Octet-RED96 emits white light from a row of probes that are attached a robotic arm. The probes move fiber optic sensors to a 96-well plate that contains the samples. After the target protein is immobilized on the biosensor surface, the sensors are moved to wells containing the ligand in solution. First association between the immobilized protein and the ligand is monitored. Then dissociation is monitored after moving the sensors to solution without the ligand. If the immobilized protein binds the ligand a changes in interference can be quantified and used to determine kinetic rates of binding and dissociation. | |
| − | + | ||
| − | + | [[Image:Fa21 M2D5 BLI setup.png|thumb|center|750px|'''The Octet-RED96 system is used to measure biomolecular interactions in a BLI experiment.''' (A) Exterior view of Octet-RED96 robot. (B) Interior view of Octet-RED96 robot with important features labeled.]] | |
| − | + | ||
| − | + | ||
| − | + | ||
| − | + | ||
| − | | | + | |
| − | + | ||
| − | + | ||
| − | | | + | |
| − | |- | + | |
| − | + | ||
| − | + | ||
| − | + | ||
| − | + | ||
| − | + | ||
| − | + | ||
| − | + | ||
| − | + | ||
| − | + | ||
| − | + | ||
| − | + | ||
| − | + | ||
| − | + | ||
| − | + | ||
| − | + | ||
| − | + | ||
| − | + | ||
| − | + | ||
| − | + | ||
| − | + | ||
| − | + | ||
| − | + | ||
| − | + | ||
| − | + | ||
| − | + | ||
| − | + | ==Protocols== | |
| − | + | ||
| − | + | ||
| − | + | ||
| − | + | ||
| − | + | ||
| − | + | ||
| − | + | ||
| − | + | ||
| − | + | ||
| − | + | ||
| − | + | ||
| − | + | ||
| − | + | ||
| − | + | ||
| − | + | ||
| − | + | ||
| − | + | ||
| − | + | ||
| − | + | ||
| + | ===Part 1: Biotinylate PF3D7_20109-F21=== | ||
| + | Protein biotinylation is necessary for immobilization on a sensor probe. Specifically, the PF3D7_20109-F21 protein needs to be biotinylated to facilitate immobilization to the Streptavidin BLI probe. For timing reasons, this step was completed in the Niles Laboratory. A detailed protocol for how this was done is linked [[Media:Fa21 M2D5 Biotinylation protocol.pdf| here]] for you to review during any downtime in class today. | ||
| − | + | For your experiments, you will be provided with a biotinylated protein stock that is at 0.5 µM in 1x PBS, pH 7.4, 1 mM TCEP (disulfide reducing agent). | |
| − | + | ||
| − | + | ===Part 2: Setup BLI assay=== | |
| + | You will prepare the samples for the BLI assay in 96 well plates. Two teams will share an assay plate and run samples together on the Octet BLI instrument. In your experiments, five dilutions of the test compound will be evaluated. | ||
| − | + | #Each team is responsible for preparing the set of samples according to the plate map for your team! Your Instructor will provide a handout with the specific plate map that should be used to each team. A generic plate map is provided below for reference. [[Image:Fa21 M2D5 generic plate map.png|thumb|center|500px]] | |
| + | #You will prepare samples using eight Eppendorf tubes, and transfer them to the specified well positions on the shared 96-well assay plate according to your plate map. | ||
| + | #Arrange and label Eppendorf tubes in a row in a rack and label (left to right) as outlined below: | ||
| + | #*B = Buffer (1x PBS, pH 7.4 + 1mM TCEP) | ||
| + | #*L = Protein “loading” solution | ||
| + | #*N = Neutralization (biocytin) solution | ||
| + | #*S1 = 2.5 µM test compound (Sample 1) | ||
| + | #*S2 = 5 µM test compound (Sample 2) | ||
| + | #*S3 = 10 µM test compound (Sample 3) | ||
| + | #*S4 = 20 µM test compound (Sample 4) | ||
| + | #*S5 = 40 µM test compound (Sample 5) | ||
| + | #Add 600 µL of buffer and protein solutions to the Eppendorf tubes labeled B and L respectively. Add 500 µL of the biocytin to the Eppendorf tube labeled N. | ||
| + | #A 40 µM working stock of test compound was prepared for you. | ||
| + | #*Add 1ml of test compound to tube S5. | ||
| + | #*Vortex to mix thoroughly. | ||
| + | #Prepare serial 2-fold dilutions of test compound in Tubes S1 – S4 as follows: | ||
| + | #*Add 500 µL of Buffer, pH 7.4 to each of tubes S1 – S4. | ||
| + | #*Tube S4: Add 500 µL of solution from Tube S5 to Tube S4, and vortex thoroughly to mix. | ||
| + | #*Tube S3: Add 500 µL of solution from Tube S4 to Tube S3, and vortex thoroughly to mix. | ||
| + | #*Tube S2: Add 500 µL of solution from Tube S3 to Tube S2, and vortex thoroughly to mix. | ||
| + | #*Tube S1: Add 500 µL of solution from Tube S2 to Tube S1, and vortex thoroughly to mix. | ||
| + | #*Transfer 200 µL of each solution from Eppendorf tubes B, L, N, S1-S5 to the wells assigned to your team’s assay plate according to the plate map. | ||
| + | #*'''IMPORTANT NOTE:''' In Column 2, you will add solution L (protein loading solution) to the top row. However, in the row below, you will add solution B (buffer). This design allows you to have a “reference” probe so you can observe how the test compound interacts with the probe, and subtract out any contribution this makes to the signal observed from the protein-loaded probe. | ||
| + | #Cover the plate until it is your turn to analyze it on the Octet instrument in the Biophysical Instrumentation Facility (BIF) located in 68-470. | ||
| − | + | ===Part 3: Complete BLI assay=== | |
| + | You will run your samples on the Octet BLI instrument. As you’ve seen in the video, the Octet automates the introduction of multiple probes into samples, and these can be moved in parallel (to the left or right) to achieve the sequence of events needed for performing quantitative binding and dissociation assays. The following pre-set sequence will be used in your assays. | ||
| − | + | #Probes immersed in Column 1 (Buffer) to begin before moving to Column 2. In Column 2, protein “Loading” onto the probes will occur in odd-numbered rows, while no protein will be loaded onto the reference probes in even-numbered rows. | |
| − | + | #*You should observe an increase in binding signal as protein binding to the probe occurs, while signal from the probe immersed in buffer remains flat. | |
| − | * | + | #Probes moved back to Column 1 (“Wash” step). [Note: Biotin binds streptavidin with very high affinity, and no appreciable dissociation of the protein will be observed during this step]. |
| − | + | #Probes moved to Column 3 containing biocytin to block all unoccupied biotin binding sites on the protein and reference probes (“Neutralization” step). This should eliminate additional signal (background) due to test compound binding to unoccupied biotin binding sites on streptavidin. | |
| − | + | #Probes moved back to Column 1 (“Wash” step). | |
| − | + | #Probes moved to Column 4 (“Association” step for the lowest test compound concentration, S1). | |
| − | + | #*Data collected on the protein-loaded probe reflects compound “associating” with the protein to form a protein-small molecule complex. | |
| − | * | + | #*Ideally, little association of compound to the probe without protein should occur. However, as the test compound concentration is increased (i.e., from S1-S5), increased compound binding to the naked probe may occur. However, this should be lower in magnitude than what is observed for the protein-loaded probe. |
| − | + | #Probes moved to Column 1 (“Dissociation” step). | |
| − | * | + | #*In this step, the small molecule unbinds from the protein complex on the probe, and gets (infinitely) diluted in the bulk buffer. The signal should exponentially decay. |
| + | #Steps #5 and #6 above are repeated for Columns 5-8 to obtain a series of association and dissociation data at progressively increasing concentrations of test compound. | ||
==Reagent list== | ==Reagent list== | ||
| − | * | + | *Biotinylation reagent (NHS-PEG4-Biotin) (from ThermoFisher Scientific) |
| − | * | + | *Biocytin (1 µg/mL stock) (from ThermoFisher Scietific) |
| + | *Biotinylated PF3D7_20109-F21 protein (0.5 µM stock) | ||
| + | *Buffer (1x PBS, pH 7.4) | ||
| + | *Streptavidin probes (from Sartorius) | ||
| + | *Compounds (10 mM stocks in DMSO)(from Chembridge) | ||
| + | *Biolayer Interferometry (BLI) instrument (Octet-Red) | ||
==Navigation links== | ==Navigation links== | ||
| − | Next day: [[20.109(F21):M2D6 | | + | Next day: [[20.109(F21):M2D6 |Complete data analysis for secondary assay]] <br> |
Previous day: [[20.109(F21):M2D4 |Assess purity and concentration of purified protein]] <br> | Previous day: [[20.109(F21):M2D4 |Assess purity and concentration of purified protein]] <br> | ||
Latest revision as of 18:07, 2 November 2021

Contents
Introduction
To test the 'hits' that were identified in the SMM screen, you will perform a BioLayer Interferometry (BLI) experiment. The BLI assay is used to measure biomolecular interactions by assessing the interference pattern of white light. In this assay, a change in the number of molecules bound to a biosensor tip result in a shift in the interference pattern. These shifts can be measured in real-time.
To measure biomolecular interactions, a layer of the protein of interest is immobilized on a biosensor tip. When the immobilized protein binds to ligand in a solution an increase in the optical thickness at the biosensor tip results in a wavelength shift. The shift is a direct measure of the change in thickness of the biological layer. Because the shift is caused by thickness of the biological layer at the biosensor tip, only the binding or dissociating of ligand generates an interference pattern.
To measure the thickness of the biological layer BLI uses fiber optic biosensors that have a proprietary biocompatible coating at the tip. The system that we will use is the Octet-RED96, which contains eight spectrophotometers. The Octet-RED96 emits white light from a row of probes that are attached a robotic arm. The probes move fiber optic sensors to a 96-well plate that contains the samples. After the target protein is immobilized on the biosensor surface, the sensors are moved to wells containing the ligand in solution. First association between the immobilized protein and the ligand is monitored. Then dissociation is monitored after moving the sensors to solution without the ligand. If the immobilized protein binds the ligand a changes in interference can be quantified and used to determine kinetic rates of binding and dissociation.

Protocols
Part 1: Biotinylate PF3D7_20109-F21
Protein biotinylation is necessary for immobilization on a sensor probe. Specifically, the PF3D7_20109-F21 protein needs to be biotinylated to facilitate immobilization to the Streptavidin BLI probe. For timing reasons, this step was completed in the Niles Laboratory. A detailed protocol for how this was done is linked here for you to review during any downtime in class today.
For your experiments, you will be provided with a biotinylated protein stock that is at 0.5 µM in 1x PBS, pH 7.4, 1 mM TCEP (disulfide reducing agent).
Part 2: Setup BLI assay
You will prepare the samples for the BLI assay in 96 well plates. Two teams will share an assay plate and run samples together on the Octet BLI instrument. In your experiments, five dilutions of the test compound will be evaluated.
- Each team is responsible for preparing the set of samples according to the plate map for your team! Your Instructor will provide a handout with the specific plate map that should be used to each team. A generic plate map is provided below for reference.
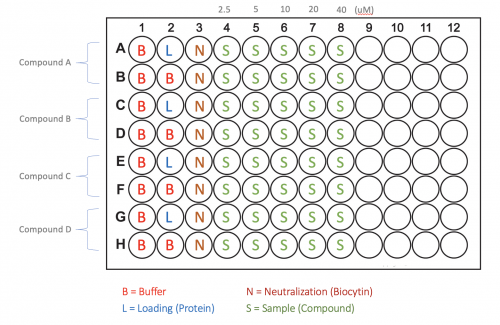

- You will prepare samples using eight Eppendorf tubes, and transfer them to the specified well positions on the shared 96-well assay plate according to your plate map.
- Arrange and label Eppendorf tubes in a row in a rack and label (left to right) as outlined below:
- B = Buffer (1x PBS, pH 7.4 + 1mM TCEP)
- L = Protein “loading” solution
- N = Neutralization (biocytin) solution
- S1 = 2.5 µM test compound (Sample 1)
- S2 = 5 µM test compound (Sample 2)
- S3 = 10 µM test compound (Sample 3)
- S4 = 20 µM test compound (Sample 4)
- S5 = 40 µM test compound (Sample 5)
- Add 600 µL of buffer and protein solutions to the Eppendorf tubes labeled B and L respectively. Add 500 µL of the biocytin to the Eppendorf tube labeled N.
- A 40 µM working stock of test compound was prepared for you.
- Add 1ml of test compound to tube S5.
- Vortex to mix thoroughly.
- Prepare serial 2-fold dilutions of test compound in Tubes S1 – S4 as follows:
- Add 500 µL of Buffer, pH 7.4 to each of tubes S1 – S4.
- Tube S4: Add 500 µL of solution from Tube S5 to Tube S4, and vortex thoroughly to mix.
- Tube S3: Add 500 µL of solution from Tube S4 to Tube S3, and vortex thoroughly to mix.
- Tube S2: Add 500 µL of solution from Tube S3 to Tube S2, and vortex thoroughly to mix.
- Tube S1: Add 500 µL of solution from Tube S2 to Tube S1, and vortex thoroughly to mix.
- Transfer 200 µL of each solution from Eppendorf tubes B, L, N, S1-S5 to the wells assigned to your team’s assay plate according to the plate map.
- IMPORTANT NOTE: In Column 2, you will add solution L (protein loading solution) to the top row. However, in the row below, you will add solution B (buffer). This design allows you to have a “reference” probe so you can observe how the test compound interacts with the probe, and subtract out any contribution this makes to the signal observed from the protein-loaded probe.
- Cover the plate until it is your turn to analyze it on the Octet instrument in the Biophysical Instrumentation Facility (BIF) located in 68-470.

Part 3: Complete BLI assay
You will run your samples on the Octet BLI instrument. As you’ve seen in the video, the Octet automates the introduction of multiple probes into samples, and these can be moved in parallel (to the left or right) to achieve the sequence of events needed for performing quantitative binding and dissociation assays. The following pre-set sequence will be used in your assays.
- Probes immersed in Column 1 (Buffer) to begin before moving to Column 2. In Column 2, protein “Loading” onto the probes will occur in odd-numbered rows, while no protein will be loaded onto the reference probes in even-numbered rows.
- You should observe an increase in binding signal as protein binding to the probe occurs, while signal from the probe immersed in buffer remains flat.
- Probes moved back to Column 1 (“Wash” step). [Note: Biotin binds streptavidin with very high affinity, and no appreciable dissociation of the protein will be observed during this step].
- Probes moved to Column 3 containing biocytin to block all unoccupied biotin binding sites on the protein and reference probes (“Neutralization” step). This should eliminate additional signal (background) due to test compound binding to unoccupied biotin binding sites on streptavidin.
- Probes moved back to Column 1 (“Wash” step).
- Probes moved to Column 4 (“Association” step for the lowest test compound concentration, S1).
- Data collected on the protein-loaded probe reflects compound “associating” with the protein to form a protein-small molecule complex.
- Ideally, little association of compound to the probe without protein should occur. However, as the test compound concentration is increased (i.e., from S1-S5), increased compound binding to the naked probe may occur. However, this should be lower in magnitude than what is observed for the protein-loaded probe.
- Probes moved to Column 1 (“Dissociation” step).
- In this step, the small molecule unbinds from the protein complex on the probe, and gets (infinitely) diluted in the bulk buffer. The signal should exponentially decay.
- Steps #5 and #6 above are repeated for Columns 5-8 to obtain a series of association and dissociation data at progressively increasing concentrations of test compound.
Reagent list
- Biotinylation reagent (NHS-PEG4-Biotin) (from ThermoFisher Scientific)
- Biocytin (1 µg/mL stock) (from ThermoFisher Scietific)
- Biotinylated PF3D7_20109-F21 protein (0.5 µM stock)
- Buffer (1x PBS, pH 7.4)
- Streptavidin probes (from Sartorius)
- Compounds (10 mM stocks in DMSO)(from Chembridge)
- Biolayer Interferometry (BLI) instrument (Octet-Red)
Next day: Complete data analysis for secondary assay