Matlab:Image Processing for Fluorescent Microscopy
Contents
Getting started
Help
The most important command in Matlab is: doc. For example, type doc imread to get the documentation for the imread command.
Loading images
Use imread to read an image file.[1]
Image representations
Matlab supports several image representations. Although all images are contained in arrays, the dimensionality, range of pixel values, and numerical data type vary among the different formats.
Monochrome intensity images are represented as a two-dimensional array of MxN pixel values, where M and N are the vertical and horizontal resolution. If the source image file is a monochrome bitmap, the output of imread will be an array of type uint8. Uint8 variables can hold integer values between 0 and 255. This limited range is not appropriate for many manipulations (like inversion, for example). A uint8 image can be converted to double precision floating point with the im2double command. The range of pixel values in a double precision image is from 0 to 1. Unsigned 16-bit and single precision floating point formats are also supported. (Matlab documentation uses the term "grayscale" instead of monochrome.)
Color images in Matlab are represented as three dimensional arrays of size MxNx3. The color image comprises three intensity images — one for each primary color red, green, and blue. (Other color spaces such as HSV are also supported.) As with monochrome images, the data type may be uint8, uint16, single, or double.
In indexed color images, each pixel value represents one color from a limited palette of predefined colors. An indexed color image requires both an MxN array of pixel values and an Lx3 matrix that serves as a palette or colormap. The colormap contains triplets of values between zero and one, where each number in the triplet specifies the contribution of a primary color (in the order red, green, blue). The length of the colormap, L, depends on the image format. For example, the colormap for a uint8 image has 256x3 entries. The color [0 1 0] is pure green. [0.5 0.5 0] is a mixture of equal parts red and green at half their full intensity[2]. There is a built-in colormap for grayscale images called "gray." The colormap command sets the palette for the current figure.
There are myriad functions built into the image processing toolbox for converting among the formats. See, for example, im2uint8, im2double, ind2rgb, and theimage processing toolbox documentation.
Matlab also supports High Dynamic Range (HDR) images, which are a topic for another day.
Displaying images
imshow, image, and imagesc are all useful commands. They behave slightly differently. (I have no idea why Mathworks prefers to write many similar functions with difficult-to-remember names instead of a single good one with options, but this rather inconvenient software design philosophy seems to pervade the toolboxes and commands.)
imagesc adjusts the contrast of an image before displaying it. This can be useful for images with unusual levels, such as a flat field correction. But it can also fool you.
Also, check out the montage command.
Adjusting contrast
imadjust and histeq can be used to adjust the contrast of an image.
Onion overlay image
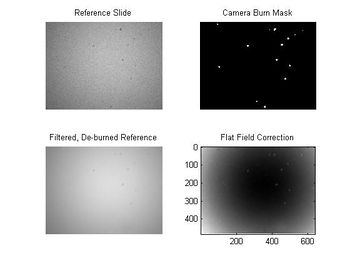
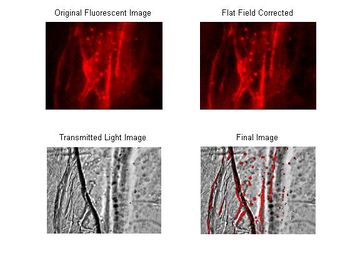
One way to determine what structures were stained by the lipophilic dye is to overlay a fluorescent image on top of a transmitted light image of the same field of view. In outline, the steps to do this are:
- flat field correct the fluorescent image
- segment the fluorescent image to create a bilevel mask image
- multiply the the fluorescent image by the mask to remove the background
- multiply the transmitted light image by the inverse of the mask to leave a "hole" where the bright objects in the fluorescent image are
- convert both images to RGB; color the fluorescent image so that it may be distinguished from the background
- add the two images together

