20.109(S19):Perform quantitative PCR experiment and explore additional RNA-seq datasets (Day5)
Introduction

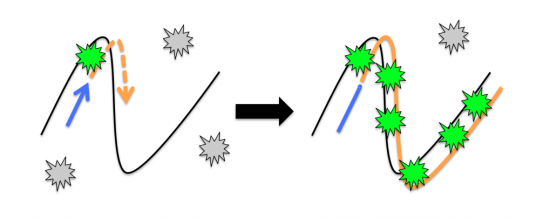
As depicted in the image to the right, the fluorescent dye binds to double-stranded DNA during the cycles of PCR. At the annealing temperature the primer (blue arrow) binds to the template (black line). During an incubation at the extension temperature the new copy of DNA (orange dashed arrow) is sythesized by the polymerase enzyme. The inactive fluorescent dye molecules present in the reaction (grey stars) bind to the newly generated double-stranded DNA and become activated (green stars).
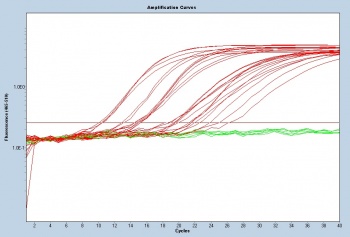
To assess gene transcript levels, you will examine the CT values from your qPCR assay. The CT values are displayed as an amplification curve following qPCR (these values are also given numerically). The initial cycles measure very little fluorescence due to low amounts of double-stranded DNA and are used to establish the inherent background fluorescence. As double-stranded product is produced, fluorescence is measured and the curve appears linear. This linear portion of the curve represents the exponential phase of PCR. Throughout the exponential phase, the curve should be smooth. Sharp points may be due to errors in reaction preparation or failures in the machine used to measure fluorescence. As mentioned previously, the first cycle in which the fluorescence measurement is above background is the CT. During the later cycles the curve shows minimal increases in fluorescence due the depletion of reagents.
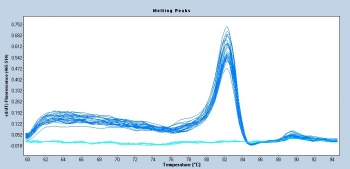
Following the qPCR amplification measurements, a melt curve is completed. Melt curves assess the dissociation of double-stranded DNA while the sample is heated. As the temperature is increased, double-stranded DNA ‘melts’ as the strands dissociate. As discussed above, the fluorescent dye used in qPCR associates with double-stranded DNA and fluorescence measurements will decrease as the temperature increases. In qPCR, the melt curve is used to confirm that a single amplification product was generated during the reaction. If additional products were present, the melt curve would presumably show additional peaks. Why might this be true? Can you think of a scenario where two different products would produce a single peak in a melt curve?
Protocols
Part 1: Perform qPCR analysis
In a previous laboratory session you purified RNA from your DLD-1 and BRCA2-/- cells and used the RNA to generate cDNA. Today you will use quantitative PCR to probe the transcription levels of your gene of interest.
Part 1a: Clean cDNA
- Retrieve your cDNA samples from the front laboratory bench.
- Add 100 μL of Buffer PB to each cDNA preparation.
- Place four QIAquick columns into collection tubes and carefully label each according to your cDNA samples.
- Transfer the entire volume of cDNA + Buffer PB (~120 μL) from each tube into the appropriate QIAquick column.
- Centrifuge at maximum speed for 30 s, then discard the flow-through.
- Add 750 μL of Buffer PE to the QIAquick columns, centrifuge at maximum speed for 30 s, then discard the flow-through.
- Centrifuge the QIAquick columns at maximum speed for 1 min.
- This will remove any residual liquid from the columns.
- Move each QIAquick column into a clean, labeled 1.5 mL centrifuge tube.
- Be sure to remove the caps so they do not break off in the centrifuge.
- To elute the DNA, add 30 μL of dH2O pH = 8 to the center of the column and leave at your benchtop for 1 min.
- Centrifuge at maximum speed for 1 min.
- The liquid in the microcentrifuge tube is your cleaned cDNA.
- Alert the teaching faculty when you have finished and place your samples on the front bench. The teaching faculty will measure the concentration of your cDNA samples with the NanoDrop.
Part 1b: Prepare primers
While you were away the sequences for the gRNA you designed were submitted to Integrated DNA Technologies (IDT). IDT synthesized the DNA oligos, or primers, then lyophilized (dried) them to a powder. The following steps were used to resuspend your oligos. Please be sure to write down relevant primer information and calculations in your lab notebook.
- Write down the original amount of DNA that arrived from IDT (written on white board)
- Calculate the amount of nuclease-free water that was needed to give a stock concentration of 100 μM.
- Calculate the volume of each stock that was required to prepare a 100 μL of solution that contains each qPCR oligo at a concentration of 10 μM.
- Tubes were centrifuged containing your lyophilized qPCR oligos for 1 min.
- Primer stocks were resuspended in the appropriate volume of sterile water, vortexed, and centrifuged.
- Primer mix was prepared by mixing appropriate volumes of forward primer, reverse primer and water into one tube.
Part 1c: Prepare cDNA for quantitative PCR assay
In addition to probing p21 transcript levels, you will also use primers specific for GAPDH. GAPDH (glyceraldehyde 3-phosphate dehydrogenase) is an enzyme that catalyzes a step of glycolysis, which serves to break down glucose for energy and carbon molecules. Because GAPDH expression should not be altered by etoposide treatment we will use its transcript levels to normalize the p21 expression levels between the DLD-1 and BRCA2-/- cell lines.
- Label 8 eppendorf tubes according to the designations below:
- A = DLD-1, GAPDH primers
- B = DLD-1 +etoposide, GAPDH primers
- C = BRCA2-/-, GAPDH primers
- D = BRCA2-/- +etoposide, GAPDH primers
- E = DLD-1, p21 primers
- F = DLD-1 +etoposide, p21 primers
- G = BRCA2-/-, p21 primers
- H = BRCA2-/- +etoposide, p21 primers
- Using the concentration measurements from Part 2b, calculate the volume of each sample that contains 20 ng of cDNA.
- If the volume is greater than 8 μL alert the teaching faculty.
- Prepare master mixes of your samples such that:
- Each reaction should contain 20 ng of cDNA, 2 μL of the appropriate diluted primer solution, and water for a total volume of 10 μL.
- The volume of water is calculated as 8 μL minus the volume calculated in Step #2 for each sample.
- For each sample/primer set combination, prepare enough master mix for 3.5 reactions.
- Give the tubes with your master mixes to the teaching faculty
Each master mix will be used to prepare three reactions (10 μL each), such that your samples are run in triplicate. This will allow you to complete statistics when you analyze the data on M2D8. To each 10 μL of sample the teaching faculty will add 10 μL of 2X SYBR Green reagent.
For your reference, the PCR cycling conditions are listed below:
| Stage | Cycles | Details |
|---|---|---|
| 1 | 1 | 95°C for 3 min |
| 2 | 40 | 95°C for 15 sec 60°C for 30 sec |
| 3 | 1 | Melt Curve Analysis |
Part 2: Analyze addition etoposide-treated RNA-seq datasets
In research, it is important to think about your data in the context of previously published research. For this exercise you will complete the same analysis methods you used to assess the class RNA-seq results, but with a different dataset.
Complete the "Analysis of RNA-seq Data Exercise" developed by Amanda Kedaigle & Prof. Ernest Fraenkel linked here.
Part 3: Begin to design cell viability experiment
The first step in designing an experiment is to define the research question. With your teammate(s) think about what questions you find interesting now that you have analyzed the RNA-seq data in the context of the data that was discussed in lecture. Specifically, how might you explain the unexpected results observed in response to etoposide treatment given the information you have gathered from the RNA-seq analysis.
By the end of today's laboratory session, prepare an outline for your experimental design (with your partner) by answering the following questions:
- What is your research question?
- You can include more than one possible research question and make a final decision later.
- What variable(s) will you test in your experiment?
- What control(s) will you include in your experiment?
Reagents
- QIAquick PCR purification kit (Qiagen)
- qPCR primers:
- GAPDH forward, 5' - GAA AGC CTG CCG GTG ACT AA - 3'
- GAPDH reverse, 5' - GCC CAA TAC GAC CAA ATC AGA G - 3'
- 2X SYBR Green (BioRad)
Next day: Design cell viability experiment and complete RNA-seq data analysis


