20.109(F16)::Measure fermentation products (Day8)

Contents
Introduction
Today you will complete the final experiment for Module 2! To measure the effect of your gRNA_target on gene expression using the CRISPRi system, you will test overnight cultures of your E. coli samples with commercially available kits that quantify either ethanol or lactate. Though the reagents for both kits are proprietary, we do know that both involve enzymatic reactions that produce a colorimetric readout.
In addition to monitoring fermentation product yield in E. coli, there are clinical reasons for quantifying ethanol and lactate. Ethanol is a central nervous system depressant that is absorbed by the bloodstream. Though the liver metabolizes the majority of consumed ethanol, some is excreted from the body via urination. Lactate production in mammals is very low. Elevated levels can signify bacterial infections or bowel conditions and extremely high levels can indicate sepsis, ischemia, or trauma.
Protocols
Part 1: Measure cell density of cultures
Before you prepare your samples to quantify the fermentation product yield, it is important that you measure the optical density (OD) of your cultures. This number will be used to normalize your data, which allows you to more accurately compare your samples. As a reminder, the OD is a measure of culture density and is based on the deflection of light at 600 nm (OD600). In this method of analysis, the higher the OD is the more dense the culture.
- Obtain an aliquot of fresh LB media and 9 plastic cuvettes from the front laboratory bench.
- Pipet 1000 μL of LB into 1 cuvette. This will serve as the blank needed to calibrate the spectrophotometer.
- Pipet 900 μL of LB into each of the 8 remaining cuvettes.
- It may be helpful to label your cuvettes with a simple designation that corresponds to your samples. Be sure that your labels are not in the light path as this will obscure your OD600 readings.
- Transfer 100 μL of each culture into the appropriate plastic cuvette.
- Note: this is a 1:10 dilution of your sample that should be accounted for in your calculations for product yield.
- Use the spectrophotometer to measure the OD600 values according to the instructions from the Orientation exercise.
- This step will be a bottleneck. Please be courteous to your laboratory mates and do not go to the spectrophotometer until your samples are fully prepared and ready to be measured.
Part 2: Quantify fermentation product yield
Please be sure to follow the appropriate protocol below.
Measuring ethanol yield
Prepare supernatants from overnight cultures
- Transfer the cultures from your aerobic tubes to fresh 15 mL conical tubes.
- Be sure to label your tubes!
- Pellet the bacterial cells in your cultures by centrifugation using the large centrifuge on the teaching faculty laboratory bench.
- Alert the teaching faculty when you are ready for centrifugation.
- Centrifuge your samples at 3000 rpm for 10 min.
- If the media is still ‘cloudy’ repeat the centrifugation step.
- Pipet 1000 μL of the supernatant from each 15 mL conical tube into a fresh 1.5 mL eppendorf tube.
- Be sure to label your tubes!
- Label 8 additional eppendorf tubes and generate 1:10 dilutions of each of your samples in a final volume of 1000 μL.
- Use fresh LB as the diluent.
Prepare samples for standard curve
- Prepare a 1 nmole/μL stock ethanol solution:
- In an eppendorf tube labeled A, combine 808.7 μL of the Ethanol Assay Buffer with 50 μL of the 17.15 N Ethanol Standard to generate a 1 μmole/μL solution.
- In an eppendorf tube labeled B, combine 990 μL of Ethanol Assay Buffer with 10 μL of solution A (from tube A) to generate a 10 nmole/μL solution.
- In an eppendorf tube labeled C, combine 900 μL of Ethanol Assay Buffer with 100 μL of solution B (from tube B) to generate a 1 nmole/μL stock ethanol solution.
- Label 5 eppendorf tubes as follows: 2 nmole, 4 nmole, 6 nmole, 8 nmole, and 10 nmole. (These will be the amounts in 50 μL samples, as will make sense in a few minutes.) Use the following steps to prepare samples for your standard curve that contain the specified amounts of ethanol.
- In the 2 nmole tube, combine 96 μL of the Ethanol Assay Buffer with 4 μL of the 1 nmole/μL stock ethanol solution you generated in Step #1.
- In the 4 nmole tube, combine 92 μL of the Ethanol Assay Buffer with 8 μL of the 1 nmole/μL stock ethanol solution you generated in Step #1.
- Prepare the 6 nmole, 8 nmole, and 10 nmole tubes.
- Note: the amount of ethanol in each tube is twice as much as specified by the label because you are preparing enough for duplicate samples (ie the contents of each tube will be divided between two wells in your assay resulting in the appropriate amount of ethanol in each well).
Complete ethanol assay
- You will prepare your assay plate according to the map below.
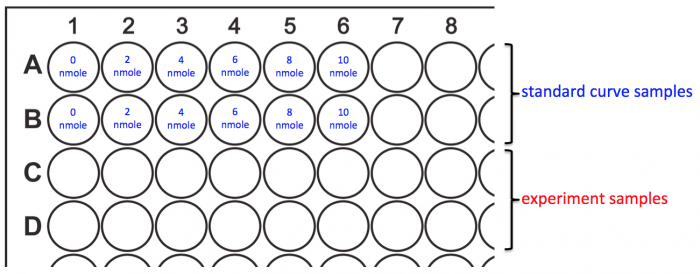 Plate map for ethanol assay setup.
- Add 50 μL of the Ethanol Assay Buffer to wells A1 and B1. This is the 0 nmole/well sample for your standard curve.
- Add 50 μL of each of the remaining standard curve samples to the appropriate wells.
- Add 50 μL of your experimental samples according to the following order:
- To C1 and D1 add MG1655 +O2 -aTc
- To C2 and D2 add MG1655 -O2 -aTc
- To C3 and D3 add MG1655 +O2 +aTc
- To C4 and D4 add MG1655 -O2 +aTc
- To C5 and D5 add MG1655 +CRISPRi +O2 -aTc
- To C6 and D6 add MG1655 +CRISPRi -O2 -aTc
- To C7 and D7 add MG1655 +CRISPRi +O2 +aTc
- To C8 and D8 add MG1655 +CRISPRi -O2 +aTc
- Calculate the amount of Reaction Mix you will need for your assay using the following information:
- To account for pipetting error, you will add an additional 10% of each component to the mixture.
- You will add 50 μL of Reaction Mix to every well (supernatants and standard curve samples).
- The Reaction Mix consists of 46 μL of Ethanol Assay Buffer, 2 μL of Ethanol Probe, and 2 μL of Ethanol Enzyme Mix per 50 μL.
- Confirm your calculations with the teaching faculty before you proceed.
- Combine the appropriate amount of Ethanol Assay Buffer, Ethanol Probe, and Ethanol Enzyme Mix in a fresh, labeled eppendorf tube.
- Add 50 μL of your Reaction Mix to each well in your 96-well plate that contains either standard or experimental samples.
- After each addition, use the pipet to mix the contents of the well.
- Be sure to change pipet tips between additions.
- Cover your 96-well plate tightly with aluminum foil and incubate at room temperature for 60 min.
- Alert the teaching faculty when your samples are ready for the spectrophotometer.
- Because the laboratory spectrophotometer is only able to measure a single sample in a cuvette, we will use a plate reader spectrophotometer in the Bio Micro Center (BMC) to measure the A570 values for your assay.

Measuring lactate yield
Prepare cell lysates from overnight cultures
- Transfer 1000 μL of each culture into a fresh 1.5-mL eppendorf tube.
- Be sure to label your tubes!
- Pellet the bacterial cells in your cultures by centrifugation using your benchtop centrifuge.
- Centrifuge your samples at maximum speed for 1 minute.
- Decant the supernatant.
- To wash the cells, resuspend each pellet in 1000 μL of cold PBS then repeat Steps #2 and #3.
- Resuspend each pellet in 200 μL of the D-Lactate Assay Buffer.
- Homogenize the samples by pipetting up and down several times.
- Centrifuge your samples for at 4 °C at 10,000 g for 10 minutes.
- Carefully transfer the supernatant from each sample to a fresh 1.5-mL eppendorf tube.
- Minimize pipetting bubbles or debris into the fresh tubes.
Prepare samples for standard curve
- Prepare a 1 nmole/μL stock D-lactate solution:
- In an eppendorf tube combine 990 μL of the Assay Buffer with 10 μL of the 100 mM D-lactate Standard
- Label 5 eppendorf tubes as follows: 2 nmole, 4 nmole, 6 nmole, 8 nmole, and 10 nmole. Use the following steps to prepare samples for your standard curve that contain the specified amounts of D-lactate.
- In the 2 nmole tube, combine 96 μL of the D-Lactate Assay Buffer with 4 μL of the 1 nmole/μL stock D-lactate solution you generated in Step #1.
- In the 4 nmole tube, combine 92 μL of the D-Lactate Assay Buffer with 8 μL of the 1 nmole/μL stock D-lactate solution you generated in Step #1.
- Prepare the 6 nmole, 8 nmole, and 10 nmole tubes.
- Note: the amount of D-lactate in each tube is twice as much as specified by the label because you are preparing enough for duplicate samples (ie the contents of each tube will be divided between two wells in your assay resulting in the appropriate amount of D-lactate in each well).
Complete lactate assay
- You will prepare your assay plate according to the map below. Plate map for ethanol assay setup.
- Add 50 μL of the D-Lactate Assay Buffer to wells A1 and B1. This is the 0 nmole/well sample for your standard curve.
- Add 50 μL of each of the remaining standard curve samples to the appropriate wells.
- Add 50 μL of your experimental samples according to the following order:
- To C1 and D1 add MG1655 +O2 -aTc
- To C2 and D2 add MG1655 -O2 -aTc
- To C3 and D3 add MG1655 +O2 +aTc
- To C4 and D4 add MG1655 -O2 +aTc
- To C5 and D5 add MG1655 +CRISPRi +O2 -aTc
- To C6 and D6 add MG1655 +CRISPRi -O2 -aTc
- To C7 and D7 add MG1655 +CRISPRi +O2 +aTc
- To C8 and D8 add MG1655 +CRISPRi -O2 +aTc
- Calculate the amount of Reaction Mix you will need for your assay using the following information:
- To account for pipetting error, you will add an additional 10% of each component to the mixture.
- You will add 50 μL of Reaction Mix to every well (cell lysates and standard curve samples).
- The Reaction Mix consists of 46 μL of the D-Lactate Assay Buffer, 2 μL of D-Lactate Substrate Mix, and 2 μL of D-Lactate Enzyme Mix per 50 μL.
- Confirm your calculations with the teaching faculty before you proceed.
- Combine the appropriate amount of D-Lactate Assay Buffer, D-Lactate Substrate Mix, and D-Lactate Enzyme Mix in a fresh, labeled eppendorf tube.
- Add 50 μL of your Reaction Mix to each well in your 96-well plate that contains either cell lysate or standard curve samples.
- After each addition, use the pipet to mix the contents of the well.
- Be sure to change pipet tips between additions.
- Cover your 96-well plate tightly with aluminum foil and incubate at room temperature for 30 min.
- Alert the teaching faculty when your samples are ready for the spectrophotometer.
- Because the laboratory spectrophotometer is only able to measure a single sample in a cuvette, we will use a plate reader spectrophotometer in the BMC to measure the A450 values for your assay.
Part 3: Data analysis
- Prepare a spreadsheet with the spectrophotometer values obtained for your assay.
- Average the technical replicates in your data set.
- Correct for the background ‘noise’ in your data by subtracting the averaged value of your 0 nmole/μL samples from the averaged values of all other samples.
- Plot the corrected values for your standard curve samples with the known concentration on the y-axis and the A570 (for ethanol) or A450 (for lactate) on the x-axis.
- Include the R-squared value and the equation of the best-fit line on your graph.
- Attach the graph to your Benchling laboratory notebook entry.
- Use the equation of the best-fit line to calculate the amount of fermentation produce in your experimental samples.
- For the ethanol assay: remember that you used a dilution of the supernatant in your assay!
- For the lactate assay: remember that you concentrated the cell lysate in your assay!
- To calculate the concentration of product, use the following equation: Sa / Sv = C
- Sa = amount of fermentation product in unknown sample (nmole) from standard curve
- Sv = sample volume (μL) added to well
- C = concentration of fermentation product in sample
- The units of this calculation will be nmole/μL. For units of ng/μL use the molecular weight value of ethanol, which is 46.07 g/mole, or lactate, which is 90.08 g/mo.
- Lastly, normalize your data to the OD600 of your initial culture to account for difference in cell number.
- Divide the amount or concentration of fermentation produced by the OD value measured.
Reagents
- Ethanol Assay Kit (Sigma-Adrich)
- D-Lactate Assay Kit (Abcam)
Next day: Module 3 starts!
Previous day: Induce CRISPRi system