Difference between revisions of "Spring 2012:Leanna Morinishi Lab 1"
(→Calibration Coefficients) |
(→Calibration Coefficients) |
||
| Line 45: | Line 45: | ||
=== Calibration Coefficients === | === Calibration Coefficients === | ||
| − | Past attempts at calibration yielded these values, which were used in the extension curve fit. (While values were found using the PSD method outlined in the 20.309 lab manual<ref>[[ | + | Past attempts at calibration yielded these values, which were used in the extension curve fit. (While values were found using the PSD method outlined in the 20.309 lab manual<ref>[[File:Optical_Trapping_Lab_Manual.pdf]]</ref> with n=14, 18, 16 at V=30, 60, 90 mW, they failed to follow a consistent logical progression, and therefore should be taken with a grain of salt. We tried using other data - from past years and this semester - to glean better results, to no avail.) |
{| border="1" cellpadding="10" cellspacing="0" style="text-align:center;" align="center" | {| border="1" cellpadding="10" cellspacing="0" style="text-align:center;" align="center" | ||
Revision as of 17:01, 5 March 2012
Lab 1: Optical Trapping
Goals
We set out to add functionality to the trap control software, specifically we wanted to automate centering of the DNA-tethered bead using a centering algorithm which we would write in MATLAB. To center the DNA-tethered bead we would need to learn how to communicate with different electronics using DAQ and the daqtoolbox in MATLAB, how to test a code which is supposed to provide specific functionality, and a bit about the UI in MATLAB. After writing the code, our goals expanded to include writing code to simulate a typical optical trap experiment. Beyond this, we tried to:
- Get nicer calibration data
- Look at the properties of the tether, to calculate the persistence and contour lengths
Skills Learned
- How to talk to the DAQ and ActiveX controls
- More about QPD and piezo-electric
- How to put a button on a UI in Matlab!!
Methodology
Materials and Instruments
- Matlab: programming language
- DAQ
- Piezoelectric Stages
- Bead size: 0.97 um beads used
- Laser wavelength: λ = 975 nm
Centering Function
- First, I learned how to activate channels, and talk to the DAQ
- I created a sine wave and had it repeat infinitely, then acquired that same data from the DAQ
- In the actual code, we decided to integrate into OTKB.m, so the following is just the functions within that code
- We begin by establishing a waveform in the x-direction, calculating the center position
- Repeat in y-direction, then x-direction 4 times
- Take the mean calculated center positions and use that as the final centering position
- Invoke piezos to reset the center voltage at our calculated position
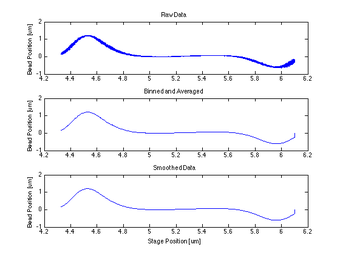
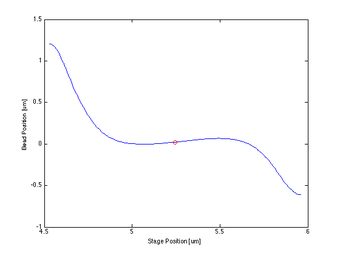
- The centering function itself required only that I bin and average my data, smooth it, then find the indices of the max and min and take information at the point between them.
Estimating contour and persistence lengths
The worm-like chain model is one method to approximate the behavior of DNA when stretched. Here we are interested in the Extension curve of a DNA tether, so that we may use its (hypothetically) linear region to calculate the place of tether attachment. We fitted our data (guided by calibration calculations) to the following model equation using nlinfit to solve for the persistence and contour lengths.
$ F = \frac{k_{B}T}{l_{p}}[(\frac{1}{4}(1 - \frac{x}{l_{c}})^{-2} - \frac{1}{4} +\frac{x}{l_{c}}] $
where $ k_{B} $ is the Boltzmann constant, $ x $ is the end-to-end distance of the DNA, $ T $ is the temperature, $ l_{c} $ is the contour length and $ l_{p} $ is the persistence length.
Calibration Coefficients
Past attempts at calibration yielded these values, which were used in the extension curve fit. (While values were found using the PSD method outlined in the 20.309 lab manual[1] with n=14, 18, 16 at V=30, 60, 90 mW, they failed to follow a consistent logical progression, and therefore should be taken with a grain of salt. We tried using other data - from past years and this semester - to glean better results, to no avail.)
| Stage um/V | QPD Sensitivity V/um | Trap Stiffness N/m | |||||
|---|---|---|---|---|---|---|---|
| Power mW | All | 20 | 70 | 120 | 20 | 70 | 120 |
| Values | 2.22 | 0.5 | 1.75 | 3.0 | 5e-5 | 1.4e-4 | 2.4e-4 |
Results
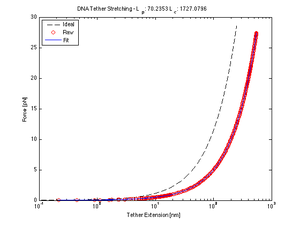
Force/Stretching Estimation using nlinfit
(Calculated contour and persistence lengths are in nm at 20mW)
- Here, nlinfit was very unstable. Given the generally accepted values for $ l_{p} $ and $ l_{c} $, it fits to give a much lower persistence length and a higher contour length, both off by an order of magnitude in opposite directions.
- Accepted Values: $ l_{p} $~45nm and $ l_{c} $~1180nm
- This is partially due to poor calibration values (listed above). The function was especially sensitive to changes in the nm ==> N coefficient.
- Also,
Proof of Concept for Center Calculation
The following data is one example, taken from tethered bead data at 20 mW. This method will work best with a tethered bead stuck in the trap at an oscillation amplitude > the length of the tether.
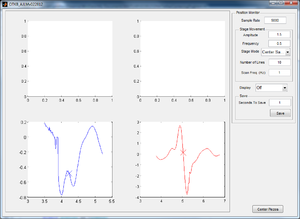
Plotting the Centering Calculation on OTKB GUI
While the stage moves in a single sinusoid in the x-direction and y-direction, the data and calculated center are plotted on the GUI for visual confirmation of working data. The left graph shows the x-direction QPD detected movement and calculated center, and the right graph shows the y-direction movement and center. In Figure 4, the stage has just moved in the y-direction and therefore the curve in the y-direction looks clean while that in the x is close to zero and inconsistent.
Code
If this is too annoying to scroll through, you can view the functions on my Public until ~June 2012.
Main DNA Tether Centering Function (Wasserman)
Find DNA Tether Center Function
Calculate persistence and contour lengths by nlinfit
Altered Code Within OTKB_OpeningFcn
    global PsdCount;
    PsdCount = 0;
    handles.XYVoltageRange = 0.05;
    set(handles.popupmenuStageMovementMode, 'String', {'Off', 'X', 'Y', 'XY Scan', 'Hypocycloid', 'Center Sample'});
    set(handles.popupmenuDisplayMode, 'String', {'Off', 'PSD', 'Surface X', 'Surface Y', 'QPD X vs Stage X',...
     'QPD Y vs Stage X', 'QPD X vs Stage Y', 'QPD Y vs Stage Y'});
Dropdown Code Within StartQpdMonitor
            case 'Center Sample'
                [handles.CenterPositionX handles.CenterPositionY] = DNATetherCenteringProblem(handles, uiSettings);
                waveform = [handles.CenterPositionX handles.CenterPositionY];
                guidata(handles.output, handles);
                set(handles.popupmenuStageMovementMode, 'Value', 1);
Centering Function
function [x y] = DNATetherCentering(handles, uiSettings)

    fprintf('+DNATetherCentering called.')
    setParams = false;
    xcenter = false;
    ycenter = false;
    for count = 1:3;
        fprintf(['+DNATetherCentering: xcenter is ' num2str(xcenter) ' ycenter is ' num2str(ycenter) '\n']);
        if ~setParams
            xaxisPiezoDriver = handles.PiezoDriverDescriptorList{1};
            yaxisPiezoDriver = handles.PiezoDriverDescriptorList{2};
            handles.SamplesToSave = uiSettings.numberOfSeconds*uiSettings.sampleRate;

            Amplitude = uiSettings.stageOscillationAmplitude;
            waveformFreq = uiSettings.stageOscillationFrequency;
            numberOfSamples = round(uiSettings.sampleRate / uiSettings.stageOscillationFrequency);
            fprintf(['DNATetherCentering: freq: ' num2str(waveformFreq) '# samples ' num2str(numberOfSamples) '\n'])
            time = linspace(0, 1/waveformFreq, numberOfSamples);
            centeringcycle = Amplitude*sin(2*pi*waveformFreq * time)';
            waveform = [(handles.CenterPositionX+centeringcycle) (handles.CenterPositionY+zeros(length(centeringcycle),1))];
            moveTime = linspace(-1, 1, 2*1e4);

            set(handles.DaqInput.ObjectHandle,'SampleRate',uiSettings.sampleRate);
            set(handles.DaqInput.ObjectHandle,'TriggerType','Manual');
            set(handles.DaqInput.ObjectHandle,'TriggerRepeat',0);
            set(handles.DaqInput.ObjectHandle,'SamplesPerTrigger',round(1.5*numberOfSamples));

            set(handles.DaqOutput.ObjectHandle,'SampleRate',uiSettings.sampleRate);
            set(handles.DaqOutput.ObjectHandle,'RepeatOutput',0);
            set(handles.DaqOutput.ObjectHandle,'TriggerType','Manual');
            fprintf('DNATetherCentering: setParams is true.\n')
            setParams = true;
        end
        fprintf('DNATetherCentering: Starting DAQ Input\n')
        start(handles.DaqInput.ObjectHandle);
        putdata(handles.DaqOutput.ObjectHandle,waveform);
        fprintf('DNATetherCentering: Starting DAQ Output\n')
        start(handles.DaqOutput.ObjectHandle);
        fprintf('DNATetherCentering: Calling Trigger\n')
        trigger(handles.DaqInput.ObjectHandle);
        trigger(handles.DaqOutput.ObjectHandle);
        data = getdata(handles.DaqInput.ObjectHandle, round(1.5*numberOfSamples));
        fprintf(['DNATetherCentering: Got ' num2str(length(data)) ' Stopping DAQ \n'])
        stop(handles.DaqInput.ObjectHandle);
        stop(handles.DaqOutput.ObjectHandle);
        findCenter;
        plot(handles.axes3, BinnedData(:,3),BinnedData(:,1),'b');
        hold(handles.axes3, 'on')
        plot(handles.axes3, BinnedData(centeredPositionIndexX,3), BinnedData(centeredPositionIndexX, 1),'bx','MarkerSize',20)
        hold(handles.axes3, 'off')
        plot(handles.axes4, BinnedData(:,4),BinnedData(:,2), 'r');
        hold(handles.axes4, 'on')
        plot(handles.axes4, BinnedData(centeredPositionIndexY,4), BinnedData(centeredPositionIndexY, 2),'rx','MarkerSize',20)
        hold(handles.axes4, 'off')

    end
fprintf('-DNATetherCentering: Complete\n')
x = handles.CenterPositionX;
y = handles.CenterPositionY;


    function findCenter

        [quantizedXAxisx Binnedx StandardDeviationx Countx] = BinData( ...
         data, 'XColumn', 3, 'YColumn', 1);
        [quantizedXAxisy Binnedy StandardDeviationy County] = BinData( ...
         data, 'XColumn', 4, 'YColumn', 2);
        currentPositionX = data(end, 3);
        currentPositionY = data(end, 4);
         BinnedData = [Binnedx' Binnedy' quantizedXAxisx' quantizedXAxisy']; % qpdx qpdy piezx piezy
        [MaxValue MaxVoltageIndexX] = max(BinnedData(:,1));
        [MinValue MinVoltageIndexX] = min(BinnedData(:,1));
        centeredPositionIndexX = floor((MinVoltageIndexX + MaxVoltageIndexX)/2);
        [MaxValue MaxVoltageIndexY] = max(BinnedData(:,2));
        [MinValue MinVoltageIndexY] = min(BinnedData(:,2));
        centeredPositionIndexY = floor((MinVoltageIndexY + MaxVoltageIndexY)/2);

        % 5.975 5.5098 > -.3705 .4911 = 4.8552 5.7424 = 5.9744 5.5131

        if ~xcenter && ~ycenter
            handles.CenterPositionX = handles.CenterPositionX +  BinnedData(centeredPositionIndexX, 3)-currentPositionX;
            waveform = [(handles.CenterPositionX*ones(length(centeringcycle),1)) centeringcycle];
            xcenter = true;

        elseif xcenter && ~ycenter
            handles.CenterPositionY = handles.CenterPositionY +  BinnedData(centeredPositionIndexY, 4)-currentPositionY;
            waveform = [handles.CenterPositionX+centeringcycle (handles.CenterPositionY*ones(length(centeringcycle),1))];
            ycenter = true;

        elseif xcenter && ycenter
            fprintf('Running DNA Tether Stretching Test \n');
        end
    end
end
Persistence and Contour Length Estimation
T = 293;        % Temperature K
k_B = 1.38e-23; % Boltzmann's constant (m^2 kg)/(s^2 K)

l_p0 = 45;       % persistence length nm (Y * I)/(k_B * T);
l_c0 = 1180;     % contour length nm

datax = load('pretty nice DNA tether 20mw 1.txt');

datax(:,3) = datax(:,3)*2.22; % 2.22 um/V
datax(:,1) = datax(:,1)/(.5); % .5 V/um

location = [1 1];

edgesx = linspace(min(datax(:,3)), max(datax(:,3)), 1e3);
[l, whichbinx] = histc(datax(:,3), edgesx);
binmeansx = zeros(1, length(edgesx-1));

for i = 1:length(edgesx)-1
    flagmembers = (whichbinx == i);
    members = datax(flagmembers,1);
    binmeansx(i) = mean(members);
end

smoothedx = smooth(binmeansx,200);
[xmin xminindex] = min(smoothedx);
[xmax xmaxindex] = max(smoothedx);
middlex = ceil(mean([xminindex xmaxindex]));

x_stage = edgesx(xmaxindex:xminindex); %, smoothedx(xmaxindex:xminindex)
x_bead = 1e3*abs(smoothedx(middlex) - smoothedx(xmaxindex:xminindex))';

y = x_bead*5e-5; % 5e-5 for 20mW
myFunction = @ (x, xdata)  forceApplied(T, x_bead, x(1), x(2));

beta = nlinfit(x_bead, y, myFunction, [l_p0, l_c0]);

figure()
semilogx(x_bead(1:353), forceApplied(T, x_bead(1:353), 45, 1180), 'k--')
hold on
semilogx(x_bead, y, 'ro')
semilogx(x_bead, forceApplied(T, x_bead, beta(1), beta(2)))
ylabel('Force [pN]')
xlabel('Tether Extension [nm]')
title(['DNA Tether Stretching - L_p: ', num2str(beta(1)), ' L_c: ', num2str(beta(2))])
legend('Ideal', 'Raw', 'Fit', 'Location', 'NorthWest')
Force Applied Function
function f = forceApplied(T, x, l_p, l_c)

k_B = 1.38e-23; % Boltzmann's constant (m^2 kg)/(s^2 K)

f = (k_B * T/l_p) * (.25 * (1-x/l_c).^(-2) - .25 + x./l_c) * 1e21; % applied force


