| Week
|
Summary
|
Assignments due
|
Lab
|
Resources
|
| Sept 8 - 11
|
Get started in the lab with the Optics Bootcamp!
|
|
Optics Bootcamp
|
Optics Bootcamp
|
|
|
|
| Sept 12 - 18
|
Finish the Optics Bootcamp and start Microscopy 1
|
Wed Sept 14: Optics Bootcamp
|
Optics Bootcamp (Mon-Tues) Microscopy 1 (Wed - Sun)
|
|
|
|
|
}
Set up the scene and adjust the exposure time
Since we are interested in how noise depends on intensity, we want to collect noise data for the largest possible range of intensities. It would also be nice to have about the same number of pixels at each intensity. The intensity histogram is a useful tool to diagnose these two criteria.
For this part of the lab, you will change your experimental set up to get an image with a approximately uniform intensity histogram. We have left it up to you to decide how to get such an image, but here are a few guidelines:
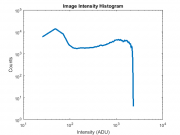
Figure 1: Example intensity histogram with approximately uniform distribution of pixel values over the range 10-2000 ADU.
- In the Device Properties tab, set the Exposure Time Abs property to 100.
- Start running the live histogram utility.
- Adjust your experiment until your histogram is a reasonably uniform distribution of pixel values between about 10 and 2000. Figure 1 shows a reasonably nice histogram. You might want to try some combination of sliding the optical components around, and adjusting the exposure time and LED current (remember not to exceed 0.5A!).
- Make a schematic including relevant distances of your final setup.
MATLAB code for plotting a histogram:
[ counts, bins ] = hist( double( squeeze( exposureTest(:) ) ), 100);
loglog( bins, counts, 'LineWidth', 3 )
xlabel( 'Intensity (ADU)' )
ylabel( 'Counts' )
title( 'Image Intensity Histogram' )
If you're curious, the hist MATLAB command takes in the intensities you measured in exposureTest, divides the range of intensities into 100 intervals or 'bins', then counts the number of pixels which fall into each bin.

|
flump
|

|
blort
|
<dpl>category=Fictitious country</dpl>
{{#dpl:
| category=Lab Manuals
}}
$ \frac{1}{2} = 0.5 $
Somewhere else on the page, you can put the following to reference the elements
Please refer to Equation 1, and Fig 2
|


