Difference between revisions of "Optical Microscopy Part 4: Particle Tracking"
| Line 76: | Line 76: | ||
* Comment on/quantify uncertainty. How can you/did you improve it? | * Comment on/quantify uncertainty. How can you/did you improve it? | ||
| − | + | {{:Optical microscopy wiki pages}} | |
| − | + | ||
==References== | ==References== | ||
| − | |||
<References/> | <References/> | ||
{{Template:20.309 bottom}} | {{Template:20.309 bottom}} | ||
Revision as of 18:17, 4 September 2013
In this part of the lab, you will investigate how a drug called cytochalasin D (CytoD) affects the structure and rheological properties of fibroblast cells. Immunofluorescent staining will be used to make the actin cytoskeleton of fibroblast cells visible. You will compare the structure of cells that have been treated with CytoD with that of untreated cells. In the next part of the procedure, you will measure how CytoD treatment affects the microrheological properties of cells. You will track small, fluorescent microspheres inside of the cells for several minutes. Using the particle tracks, you will calculate the frequency-dependent storage and loss moduli of the environment inside the cells.
Part 1: imaging the actin cytoskeleton
Fixing and labeling cells
Prepare a dish of fixed fibroblast cells (NIH 3T3), whose actin will be labeled with phalloidin-Alexa Fluor 568. The labeling protocol is as follows:
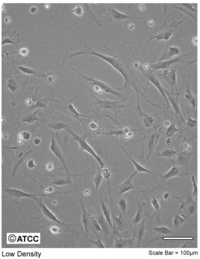
- Start with cells cultured in dishes containing DMEM++, at approximately 60% confluency. This is about the optimum percentage of cell population. If cells are too crowded, they will not stretch properly and show their beautiful actin filaments. Note also that these cells remain alive until the addition of formaldehyde, therefore requiring that any buffer/media added be pre-warmed.
- Pre-warm 3.7% formaldehyde solution, DMEM and PBS in a 37°C water bath. Keep the solution wrapped in foil to protect from light.
- Retrieve an aliquot of cytochalasin D from the freezer and warm in the water bath to 37°C.
- After you get your dishes from the instructor, first remove the medium with a pipette and wash each dish twice with 2 mL of pre-warmed phosphate buffered saline (PBS) at pH 7.4 (also in the water bath). Pipet up and down into the dish gently to avoid washing away cells.
- Carefully pipet 400 μL of 3.7% formaldehyde solution onto the central glass region of the dish and leave it for 10 minutes at room temperature. This "fixes" the cells, i.e. cross-links the intracellular proteins and freezes the cell structure.
- Wash the cells 3X with 2 mL PBS (note that this PBS solution no longer needs to be pre-warmed as the cells are dead).
- Extract each dish with 2 mL 0.1% Triton X-100 (a type of soap solution in PBS) for 3-5 minutes. (Extraction refers to partially dissolving the plasma membrane of the cell.)
- Wash the cells 3X with PBS.
- Incubate the fixed cells with 2 mL 1% BSA in PBS for 20 minutes. (BSA blocks the nonspecific binding sites.)
- Wash cells 2X with PBS.
- To each cell dish, add 200 μL of Alexa Fluor 568 phalloidin solution (specific binder to F-actin) pre-mixed in methanol and PBS. Carefully pipet this just onto the center of the dish, cover with aluminum foil, and incubate for 45 minutes at room temperature.
- Wash 3X with PBS.
- You can now store the sample at +4°C (regular refrigerator) in PBS for a few days, wrapped in parafilm and foil. It can also be stored in mounting medium for up to 1 year.
By a very similar procedure, you should also prepare cells treated with cytochalasin D (CytoD): Before adding the formaldehyde, add 1 mL of the pre-warmed 10 μM CytoD solution to the cell culture dish and incubate at 37°C for 20 minutes. Afterwards, wash 2X with DMEM++.
Quantifying cellular microrheology
Read Cellular microrheology.
Instructions
Actin imaging
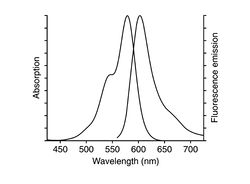
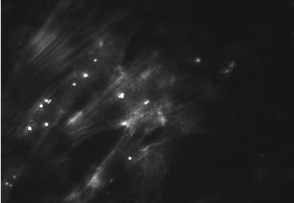
Actin can be imaged using immunofluorescent staining with a mushroom toxin called phalloidin. The phalloidin you will use has been conjugated to a fluorescent dye called Alexa Fluor 568. Phalloidin binds to polymerized filamentous actin (F-actin), but not to actin monomers (G-actin).
| |
Wear gloves when you are handling biological samples. |
Since actin filaments and stress fibers are nanometer-scale objects, they are much dimmer than fluorescent
beads or the dye solution - care must be taken to get good images of the cytoskeleton. You may
need to cover the microscope to reduce room light contamination.
- Adjust the gain and exposure of the camera to get the best picture. Be sure to keep the same exposure conditions, however, for both untreated and CytoD-treated cells.
- Using the 40x objective, take some good fluorescence images of Alexa Fluor phalloidin-labeled cells, both untreated and CytoD-treated.
Live cell microrheology by particle traking
Now that you have verified microscope stability and performance through the particle tracking lab, you can apply its methods on cell samples. A key technique to keep in mind when working with live cells - to avoid shocking them with "cold" at 20°C - is to be sure that any solutions you add are pre-warmed to 37°C. We will keep a warm-water bath running for this purpose, in which we will keep the various media.
You are provided with NIH 3T3 fibroblasts, which were prepared as follows: Cells were cultured at 37°C in 5% CO$ _2 $ in standard T75 flasks in a medium referred to as DMEM++. This consists of Dulbecco's Modified Eagle Medium (DMEM - Invitrogen) supplemented with 10% fetal bovine serum (FBS - Invitrogen) and 1% of the antibiotic penicillin-streptomycin (Invitrogen). The day prior to the microrheology experiments, fibroblasts were plated on 35 mm glass-bottom cell culture dishes (MatTek). On the day of the experiments, the cell confluency should reach about 60%. 1 μm diameter red fluorescent microspheres (Corpuscular) were mixed with the growth medium (at a concentration of 5 x 10$ ^5 $ beads/mL) and added to the plated cells for a period of 12 to 24 hours for bead endocytosis.
- Carefully pipet out the medium from both dishes. Replace with 2 mL of fresh, pre-warmed DMEM++ in each dish.
- Choose cells with 3 or 4 particles embedded in them and capture movies of the samples. Take multiple movies with about 3-5 cells in the field of view in each movie.
- In one of the dishes, treat the cell with the cytoskeleton-modifying chemical cytochalasin D (CytoD): Pipet out the medium, add 1 mL CytoD solution at 10 μM (pre-mixed for you) to the dish, and wait for 20-30 minutes. It's a good idea to check on your cells after 20 minutes: sometimes they are in bad shape at that point but sometimes they still look very healthy. Wash 2X with 2 mL of pre-warmed DMEM++, leaving 2 mL in the dish when imaging.
- Perform and repeat the particle tracking measurements again as quickly as you are able. The cells' physiology has now been significantly disrupted by the toxin CytoD, and they will die within a couple of hours. It's very unlikely that you'll be able to find the exact same cells you've already tracked; however it's very much advisable to use the same dish for the "before" and "after" so you're aren't also comparing between different cell populations.
Report: Experiments in fibroblast cells
Report your findings on NIH 3T3 actin visualization and cytoplasm microrheology.
- Quantify your investigations of the actin structure.
- Use an application such as Matlab to measure observed min/max separation between centers of the actin strands.
- Measure min/max observed lengths of actin strands.
- Comment on the effect of actin density as it relates to bead size in the microrheology portion.
- If you wish, reference your favorite article to compare your images.
- Quantify your investigations of the cytoplasm/cytoskeleton microrheology.
- Present your MSD vs sampling time τ data in log-log plot form and comment.
- Use your MSD vs τ data to calculate estimates of G' and G" as described in Cellular microrheology.
- Compare your results to the literature provided and/or any other relevant literature.
- Comment on/quantify uncertainty. How can you/did you improve it?
References


