Difference between revisions of "Lab Manual: Optical Microscopy"
Steven Nagle (Talk | contribs) (→Experiment 1:microscope construction and characterization) |
Steven Nagle (Talk | contribs) |
||
| Line 126: | Line 126: | ||
Peremyslov, V., et. al. [http://www.plantphysiol.org/cgi/content/abstract/146/3/1109?ijkey=d2fc9d28a65f10e0bcab68c3442cd4d3f8362e16&keytype2=tf_ipsecsha Two Class XI Myosins Function in Organelle Trafficking and Root Hair Development in Arabidopsis]. Plant Physiology 146:1109-1116 (2008) | Peremyslov, V., et. al. [http://www.plantphysiol.org/cgi/content/abstract/146/3/1109?ijkey=d2fc9d28a65f10e0bcab68c3442cd4d3f8362e16&keytype2=tf_ipsecsha Two Class XI Myosins Function in Organelle Trafficking and Root Hair Development in Arabidopsis]. Plant Physiology 146:1109-1116 (2008) | ||
| + | ==Experiment 3: tracking particles in suspension== | ||
| − | === | + | ====Introduction and background<ref name="BMC">taken from http://labs.physics.berkeley.edu/mediawiki/index.php/Brownian_Motion_in_Cells</ref>==== |
| − | + | ||
| − | |||
| − | |||
| − | |||
| − | |||
| − | |||
| − | |||
| − | |||
| − | |||
| − | |||
| − | |||
| − | |||
| − | |||
| − | |||
| − | |||
| − | |||
| − | |||
| − | |||
| − | |||
| − | |||
| − | |||
| − | |||
| − | |||
| − | |||
| − | |||
| − | |||
| − | |||
| − | |||
| − | |||
| − | |||
| − | |||
| − | |||
| − | |||
| − | |||
| − | |||
| − | |||
| − | |||
| − | |||
| − | |||
| − | |||
| − | |||
| − | |||
| − | |||
| − | |||
| − | |||
| − | |||
| − | |||
| − | |||
If you have ever looked at an aqueous sample through a microscope, you have probably noticed that every small particle you see wiggles about continuously. Robert Brown, a British botanist, was not the first person to observe these motions, but perhaps the first person to recognize the significance of this observation. Experiments quickly established the basic features of these movements. Among other things, the magnitude of the fluctuations depended on the size of the particle, and there was no difference between "live" objects, such as plant pollen, and things such as rock dust. Apparently, finely crushed pieces of an Egyptian mummy also displayed these fluctuations. | If you have ever looked at an aqueous sample through a microscope, you have probably noticed that every small particle you see wiggles about continuously. Robert Brown, a British botanist, was not the first person to observe these motions, but perhaps the first person to recognize the significance of this observation. Experiments quickly established the basic features of these movements. Among other things, the magnitude of the fluctuations depended on the size of the particle, and there was no difference between "live" objects, such as plant pollen, and things such as rock dust. Apparently, finely crushed pieces of an Egyptian mummy also displayed these fluctuations. | ||
| Line 188: | Line 141: | ||
===Microscope stability for particle tracking=== | ===Microscope stability for particle tracking=== | ||
| + | |||
To verify that your system is sufficiently stable for accurate particle tracking, measure a dry specimen containing 1μ beads in bright field contrast. Chose a field of view in which you can see at least 3-4 beads. Using a 40x objective, track the beads for about 3 min. Use the bead tracking processing algorithm on two beads to calculate two trajectories. To further reduce common-mode motion from vibrations, calculate the differential trajectory from the individual trajectories of these two beads. Calculate the MSD from the differential trajectory. Your MSD should start out less than 10 nm<sup>2</sup> at t = 1 sec. and still be less than 100 nm2 for t = 180 sec. | To verify that your system is sufficiently stable for accurate particle tracking, measure a dry specimen containing 1μ beads in bright field contrast. Chose a field of view in which you can see at least 3-4 beads. Using a 40x objective, track the beads for about 3 min. Use the bead tracking processing algorithm on two beads to calculate two trajectories. To further reduce common-mode motion from vibrations, calculate the differential trajectory from the individual trajectories of these two beads. Calculate the MSD from the differential trajectory. Your MSD should start out less than 10 nm<sup>2</sup> at t = 1 sec. and still be less than 100 nm2 for t = 180 sec. | ||
===Estimating the diffusion coefficient by tracking suspended microspheres=== | ===Estimating the diffusion coefficient by tracking suspended microspheres=== | ||
| + | |||
According to theory,<ref>A. Einstein, [https://lyle.smu.edu/ee/5375/downloads/Lectures/Lecture11/einstein-bm.pdf On the Motion of Small Particles Suspended in Liquids at Rest Required by the Molecular-Kinetic Theory of Heat], Annalen der Physik (1905).</ref><ref>E. Frey and K. Kroy, [http://www3.interscience.wiley.com/cgi-bin/abstract/109884431/ Brownian motion: a paradigm of soft matter and biological physics], Ann. Phys. (2005). Published on the 100th anniversary of Einstein’s paper, this reference chronicles the history of Brownian motion from 1905 to the present.</ref><ref>R. Newburgh, [http://scitation.aip.org/journals/doc/AJPIAS-ft/vol_74/iss_6/478_1.html Einstein, Perrin, and the reality of atoms: 1905 revisited], Am. J. Phys. (2006). A modern replication of Perrin's experiment. Has a good, concise appendix with both the Einstein and Langevin derivations.</ref><ref>M. Haw, [http://stacks.iop.org/JPhysCM/14/7769 Colloidal suspensions, Brownian motion, molecular reality: a short history], J. Phys. Condens. Matter (2002).</ref> the mean squared displacement of a suspended particle is proportional to the time interval as: <math>\left \langle {\left | \vec r(t+\tau)-\vec r(t) \right \vert}^2 \right \rangle=2Dd\tau</math>, where <i>r</i>(<i>t</i>) = position, <i>d</i> = number of dimensions, <i>D</i> = diffusion coefficient, and <math>\tau</math>= time interval. | According to theory,<ref>A. Einstein, [https://lyle.smu.edu/ee/5375/downloads/Lectures/Lecture11/einstein-bm.pdf On the Motion of Small Particles Suspended in Liquids at Rest Required by the Molecular-Kinetic Theory of Heat], Annalen der Physik (1905).</ref><ref>E. Frey and K. Kroy, [http://www3.interscience.wiley.com/cgi-bin/abstract/109884431/ Brownian motion: a paradigm of soft matter and biological physics], Ann. Phys. (2005). Published on the 100th anniversary of Einstein’s paper, this reference chronicles the history of Brownian motion from 1905 to the present.</ref><ref>R. Newburgh, [http://scitation.aip.org/journals/doc/AJPIAS-ft/vol_74/iss_6/478_1.html Einstein, Perrin, and the reality of atoms: 1905 revisited], Am. J. Phys. (2006). A modern replication of Perrin's experiment. Has a good, concise appendix with both the Einstein and Langevin derivations.</ref><ref>M. Haw, [http://stacks.iop.org/JPhysCM/14/7769 Colloidal suspensions, Brownian motion, molecular reality: a short history], J. Phys. Condens. Matter (2002).</ref> the mean squared displacement of a suspended particle is proportional to the time interval as: <math>\left \langle {\left | \vec r(t+\tau)-\vec r(t) \right \vert}^2 \right \rangle=2Dd\tau</math>, where <i>r</i>(<i>t</i>) = position, <i>d</i> = number of dimensions, <i>D</i> = diffusion coefficient, and <math>\tau</math>= time interval. | ||
| Line 200: | Line 155: | ||
==Experiment 4: Transport in a plant cell<ref name="BMC" />== | ==Experiment 4: Transport in a plant cell<ref name="BMC" />== | ||
| + | |||
{|align="left" | {|align="left" | ||
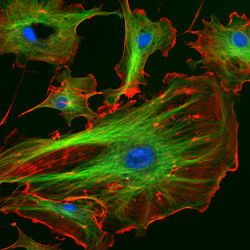
| [[Image:BMC_Cytoskeleton.jpg|thumb|250px|center|The eukaryotic cytoskeleton. Actin filaments are shown in red, microtubules in green, and the nuclei are in blue.]] | | [[Image:BMC_Cytoskeleton.jpg|thumb|250px|center|The eukaryotic cytoskeleton. Actin filaments are shown in red, microtubules in green, and the nuclei are in blue.]] | ||
| Line 239: | Line 195: | ||
==Report Requirements== | ==Report Requirements== | ||
| + | |||
Please use the suggested report outline here: [[Microscopy report outline]] | Please use the suggested report outline here: [[Microscopy report outline]] | ||
==References== | ==References== | ||
| + | |||
<References/> | <References/> | ||
{{Template:20.309 bottom}} | {{Template:20.309 bottom}} | ||
Revision as of 23:35, 9 August 2012
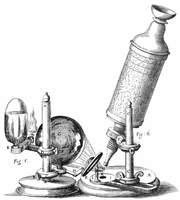
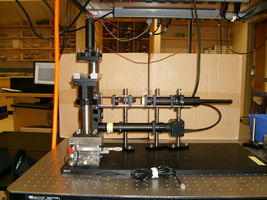
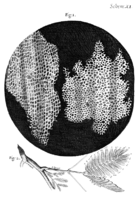
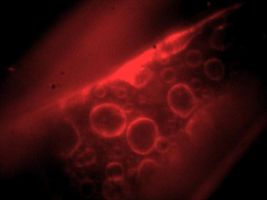
| 1665 | 2009 |
|---|---|
|
Robert Hooke's microscope |
20.309 student's microscope |
|
Hooke micrograph of cork cells |
CCD image of fluorescent labeled intracellular membranes[1] |
I took a good clear piece of Cork, and with a Pen-knife sharpen'd as keen as a Razor, I cut a piece of it off, and thereby left the surface of it exceeding smooth, then examining it very diligently with a Microscope, me thought I could perceive it to appear a little porous; but I could not so plainly distinguish them, as to be sure that they were pores, much less what Figure they were of: But judging from the lightness and yielding quality of the Cork, that certainly the texture could not be so curious, but that possibly, if I could use some further diligence, I might find it to be discernable with a Microscope, I with the same sharp Penknife, cut off from the former smooth surface an exceeding thin piece of it, and placing it on a black object Plate, because it was it self a white body, and casting the light on it with a deep plano-convex Glass, I could exceeding plainly perceive it to be all perforated and porous, much like a Honey-comb, but that the pores of it were not regular; yet it was not unlike a Honey-comb in these particulars.
Don't you jusy buy a [expletive deleted] microscope?[3]
Introduction
Since Robert Hooke noticed that the pores in a very thin sample of cork reminded him of the small rooms called cells where monks sleep in a monastery, the optical microscope has been a tool of central importance. But Hooke did more than notice the sample's texture. He also made perhaps the first quantitative measurements of cells with an optical microscope:
I told several lines of these pores, and found that there were usually about threescore of these small Cells placed end-ways in the eighteenth part of an Inch in length, whence I concluded there must be neer eleven hundred of them, or somewhat more then a thousand in the length of an Inch, and therefore in a square Inch above a Million, or 1166400. and in a Cubick Inch, above twelve hundred Millions, or 1259712000. a thing almost incredible, did not our Microscope assure us of it by ocular demonstration.
— Robert Hooke[2]
Improvements in optical components, microscope designs, illuminators, imaging devices, and sample preparation methodologies fostered increasingly sophisticated discoveries in the three and a half centuries since Micrographia. Barbara McClintock observed genetic transposition through an optical microscope by in 1944, for example. She was a talented microscopist who developed a technique that let her visualize and differentiate individual chromosomes in Zea Mays (corn) plant cells. McClintock was awarded the Nobel Prize in Physiology or Medicine in 1983 for this discovery. It took several decades before molecular techniques sufficiently sophisticated to confirm her discovery were developed.[5]
In this lab, you will design and build an optical microscope from components. You will characterize the performance of your instrument and make images using two different contrast methodologies: transmitted brightfield and epifluorescence. Using particle tracking computer software, you will make quantitative measurements of small suspended particles in Brownian motion. Finally, you will use your microscope to make quantitative measurements of vesicle trafficking in live plant cells. (In particular, you will estimate the number of ATP molecules per second required for intracellular transport of vesicles.)
In past semesters, several student groups have undertaken final projects that involved expanding the capabilities of their microscope, including implementing scanning-sample confocal and darkfield contrast modes.
Objectives
- Learn about the theory and practice of light microscopy
- Use ray tracing rules to design a transmitted bright field and fluorescent light microscope
- Construct the microscope from optical components
- Characterize the microscope's performance
- Record, enhance, and analyze microscope images
- Track moving particles
- Make quantitative measurements of biological systems
How to do this lab
Week 1: microscope design and construction
- Read the references; understand lenses, ray tracing, and magnification
- Design and build microscope
- Characterize the transmitted bright field performance of the microscope
- Add a laser illumination beam path
Week 2: instrument characterization
- Characterize the fluorescent imaging performance of the microscope
- Image fluorescent samples
- Correct images for nonuniform illumination
Week 3
- Track microspheres suspended in a solvent
- Estimate diffusion coefficients; compute Avagadro's number
- Track the motion of vesicles under transport in a plant cell
- Estimate the number of myosin motors involved in vesicle transport
Week 4: data analysis, image processing and report writing
Microscopy lab etiquette
During the microscopy lab, approximately two thousand optical components will be taken from stock, assembled into microscopes, and properly returnd to their assigned places. With the goal of keeping the frustration level to a minimum, please observe the following:
- Observe laser safety guidelines.
- Wear gloves when you are handling biological samples.
- Store your microscope in one of the cubby holes in 16-317. If you use one of the high shelves, get somebody to help you lift.
- Keep all of the boxes for the optics you use with your instrument to simplify putting things away.
- Take a blue bin to store loose items (such as lens boxes) in.
- Stages, CCD cameras, and barrier filters stay at the lab station. Do not store these with your microscope.
- Do not move CCD cameras from one station to another.
- Return objective lenses to the drawer when you are not using them. (Do not store them with your microscope.)
- The stages are very expensive. Always lift from the bottom.
- Ask a TA or instructor for help if you need to clean a dichroic or barrier filter. (These optics have exposed coatings and must be cleaned with extra care.)
- Check the focal length of lenses before you use them. Some students before you have been very bad at the three-of-these-things game. If you find an optic in the wrong box: identify the optic and replace it in the correct box. (Ask an instructor or TA if you can't find the right box.)
- Never use an SM1T2 coupler without a locking ring — they are very difficult to remove if they are tightened against a lens tube or tube ring.
- Use tube rings (never an SM1T2, SM1V01, or SM1V05) to mount optics in lens tubes.
- If you break something (or discover something pre-broken for you), do not return it to the component stock. Give all broken items to an instructor or TA.
- Please do not remove parts from the TA microscope
- Each group should be able to receive their own LED and dichroic mirror. Please ask a TA if you need one.
- Many students have had trouble with where to begin as they design the microscope. Read through this lab manual carefully, many of the design constraints and tradeoffs have been outlined.
- A good plan will often save you time and headaches down the road.
Brownian motion
R. Newburgh, Einstein, Perrin, and the reality of atoms: 1905 revisited, Am. J. Phys. (2006). A modern replication of Perrin's experiment. Has a good, concise appendix with both the Einstein and Langevin derivations.
Other good sources
Brownian motion
A. Einstein, On the Motion of Small Particles Suspended in Liquids at Rest Required by the Molecular-Kinetic Theory of Heat, Annalen der Physik (1905).
M. Haw, Colloidal suspensions, Brownian motion, molecular reality: a short history, J. Phys. Condens. Matter (2002).
E. Frey and K. Kroy, Brownian motion: a paradigm of soft matter and biological physics, Ann. Phys. (2005).
Myosin XI and vesicle trafficking in plant cells
Nebenfuhr Lab: The Plant Myosin Page
Tominaga, et. al. Higher plant myosin XI moves processively on actin with 35 nm steps at high velocity. The EMBO Journal Vol. 22 No. 6 pp. 1263-1272, 2003
S. Bolte, C. Talbot, Y. Boutte, O. Catrice, N. D. Read, B. Satiat-Jeunemaitre. FM-dyes as experimental probes for dissecting vesicle trafficking in living plant cells. Journal of Microscopy 214(2): 159-173 (May 2004).
Avisar, et. al. Myosin XI-K Is Required for Rapid Trafficking of Golgi Stacks, Peroxisomes, and Mitochondria in Leaf Cells of Nicotiana benthamiana1. Plant Physiology 146:1098-1108 (2008)
Peremyslov, V., et. al. Two Class XI Myosins Function in Organelle Trafficking and Root Hair Development in Arabidopsis. Plant Physiology 146:1109-1116 (2008)
Experiment 3: tracking particles in suspension
Introduction and background[6]
If you have ever looked at an aqueous sample through a microscope, you have probably noticed that every small particle you see wiggles about continuously. Robert Brown, a British botanist, was not the first person to observe these motions, but perhaps the first person to recognize the significance of this observation. Experiments quickly established the basic features of these movements. Among other things, the magnitude of the fluctuations depended on the size of the particle, and there was no difference between "live" objects, such as plant pollen, and things such as rock dust. Apparently, finely crushed pieces of an Egyptian mummy also displayed these fluctuations.
Brown noted: [The movements] arose neither from currents in the fluid, nor from its gradual evaporation, but belonged to the particle itself.
This effect may have remained a curiosity had it not been for A. Einstein and M. Smoluchowski. They realized that these particle movements made perfect sense in the context of the then developing kinetic theory of fluids. If matter is composed of atoms that collide frequently with other atoms, they reasoned, then even relatively large objects such as pollen grains would exhibit random movements. This last sentence contains the ingredients for several Nobel prizes!
Indeed, Einstein's interpretation of Brownian motion as the outcome of continuous bombardment by atoms immediately suggested a direct test of the atomic theory of matter. J. Perrin received the 1926 Nobel Prize for validating Einstein's predictions, thus confirming the atomic theory of matter.
Since then, the field has exploded, and a thorough understanding of Brownian motion is essential for everything from polymer physics to biophysics, aerodynamics, and statistical mechanics. One of the aims of this lab is to directly reproduce the experiments of J. Perrin that lead to his Nobel Prize. A translation of the key work is included in the reprints folder. Have a look – he used latex spheres, and we will use polystyrene spheres, but otherwise the experiments will be identical. In addition to reproducing Perrin's results, you will probe further by looking at the effect of varying solvent molecule size.
Microscope stability for particle tracking
To verify that your system is sufficiently stable for accurate particle tracking, measure a dry specimen containing 1μ beads in bright field contrast. Chose a field of view in which you can see at least 3-4 beads. Using a 40x objective, track the beads for about 3 min. Use the bead tracking processing algorithm on two beads to calculate two trajectories. To further reduce common-mode motion from vibrations, calculate the differential trajectory from the individual trajectories of these two beads. Calculate the MSD from the differential trajectory. Your MSD should start out less than 10 nm2 at t = 1 sec. and still be less than 100 nm2 for t = 180 sec.
Estimating the diffusion coefficient by tracking suspended microspheres
According to theory,[7][8][9][10] the mean squared displacement of a suspended particle is proportional to the time interval as: $ \left \langle {\left | \vec r(t+\tau)-\vec r(t) \right \vert}^2 \right \rangle=2Dd\tau $, where r(t) = position, d = number of dimensions, D = diffusion coefficient, and $ \tau $= time interval.
- Track some 3μm (Samples A & B) and 5μm (Samples C & D) microspheres.
- Estimate the diffusion coefficient of these microspheres suspended in solutions of varying viscosities. For reference, Sample A contains 3μm spheres suspended in water.
- Consider how many particles you should track and for how long. What is the uncertainty in your estimate?
See: this page for more discussion of Brownian motion and a Matlab simulation.
Experiment 4: Transport in a plant cell[6]
In the fourth part of this experiment, you will characterize the motion of particles inside a living cell.
An out-of-date view of a cell was that it is a "bag of water" containing various enzymes in which matter is transported passively by diffusion. Though diffusion is an important mechanism, it is too slow and random for long distance transport and directing materials where they are most needed, especially in larger cells. It is now understood that cells have highly developed and intricate mechanisms for directed transport of materials.
Cells transport food, waste, information, etc. in membrane-bound vesicles, which are visible under a light microscope.
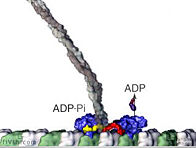
Most motions within and of cells involve two components, a cytoskeletal fiber that serves as a track, and a motor protein that does the work. The motor molecule uses energy from the hydrolysis of one ATP molecule to bind to the fiber, bend to pull itself along the fiber, and release, all of which constitutes one "step". For an animation of this stepping process, see this movie animation from the Vale lab web site at UC San Francisco. Additional videos are available here and here. One can divide cellular motility mechanisms into two classes based on the cytoskeletal fibers involved. Microtubule-based mechanisms involve dynein or kinesin motors pulling on microtubules made of the protein tubulin. Actin-based mechanisms involve myosin motors pulling on actin fibers, also called microfibers.
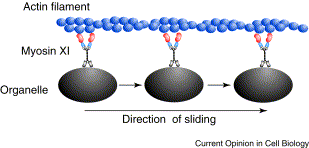 Cartoon (above) and video of myosin motors pulling organelles along an actin filament. |
Virtually all cell types exhibit directed intracellular transport, but some cell types are particularly suitable for transport studies. Fish-scale pigment cells work well, since a large fraction of the cargoes that are transported are pigmented and thus easy to observe – the disadvantage is that you would need to bring a living fish into lab as a source of these cells. For convenience, we will use epidermal cells from onion bulbs that you can easily acquire in a grocery store. With some care, a single layer of cells can be peeled off an inner section of the onion bulb and mounted flat on a slide.
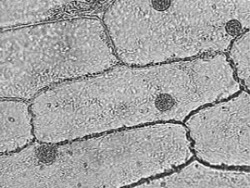
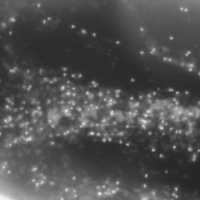
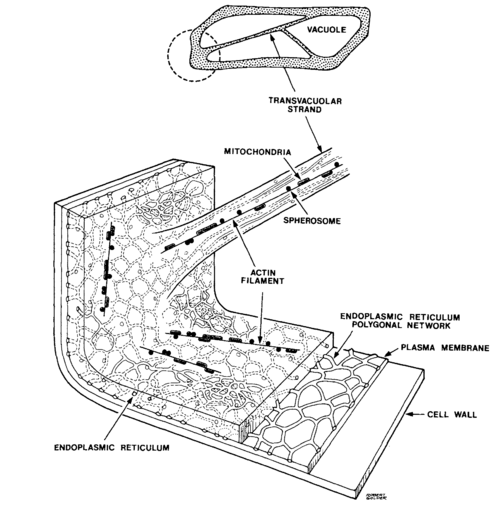
In this experiment, we will be viewing the movement of vesicles within the cytoplasm of onion epidermal cells, shown above as they appear in bright-field and dark-field microscopy. The layers you see in an onion bulb develop into leaves when it sprouts. Both sides of the leaf are covered with an epidermis consisting of brick-shaped cells, each with a cell wall and cell membrane on the outside.
Most of the interior of the cell is filled with a clear vacuole that functions in storage and in maintenance of hydrostatic pressure essential to the stiffness of the plant (the difference between crisp lettuce and wilted lettuce). The cytoplasm, containing all of the other cell contents, occurs in a thin layer between the cell membrane and the vacuole, and in thin extensions through the vacuole called transvacuolar strands. It is within the cytoplasm that you will be observing directed transport of vesicles by an actin-based mechanism.
These vesicles are spherical or rod-shaped organelles such as mitochondria, spherosomes, and peroxisomes ranging in size from 0.5 to 3 microns. The diagram of an onion cell below shows the location of the cell wall, cytoplasm and vesicles in a typical cell; you will not be able to see much of the endoplasmic reticulum or the vacuole depicted because of their transparency. Under the microscope, you will notice the vesicles are located just along the edges of the cell, or near the top and bottom surface if you focus up and down. When you see a narrow band of moving vesicles in the center of the cell, it is located in a transvacuolar strand, which may be a handy place to study motion.
In plant cells, vesicles are transported along actin fibers by myosin motor molecules. An actin filament is composed of two intertwined actin chains, about 7 nm in diameter. An actin fiber is structurally polar, having a (+) end and a (-) end. Most myosin motors move towards the (+) end of the actin fiber. In order to reverse the direction of a vesicle's motion, the vesicle must grab on to another actin fiber oriented in the opposite direction.
There are at least eighteen described classes of myosin, of which three, myosin VIII, XI, and XII are found in plant cells. Some myosin motors are processive, meaning that they remain bound to an actin fiber as they move step-by-step along it (analagous to this movie animation of kinesin). Other myosins are non-processive, releasing from the actin fiber after each step. Myosin II found in muscle cells is non-processive, as illustrated in this video animation. In the muscle functional unit, there are many myosin motors acting together, so there are always some attached to the actin fiber. The myosin XI responsible for transport of plant cell vesicles is the fastest myosin known and is processive. It apparently is not known how many myosin molecules are attached to the surface of a vesicle or how many of those are active at one time in pulling the vesicle along an actin fiber.
In some plant cells and algal cells, a large-scale streaming motion of the cytoplasm is observed, logically called cytoplasmic streaming. This bulk flow is believed to be caused by myosin motors pulling the extensive endoplasmic reticulum along actin fibers lining the cell membrane. Many other vesicles are then dragged along with the endoplasmic reticulum. Lodish and Berk, et al. provide a detailed explanation of this process and a video of cytoplasmic streaming in the pond eeed Elodea can be viewed here.
In your observations of vesicles in onion epidermal cells, you should distinguish between the random Brownian motion of vesicles that are unattached (or at least not actively moving along) actin filaments, the directed transport of vesicles by attached myosin motors, and possibly (though we are not sure this really happens in onions) bulk flow of vesicles in cytoplasmic streaming.
Report Requirements
Please use the suggested report outline here: Microscopy report outline
References
- ↑ Onion endothelial cell incubated with FM 4-64 dye (Invitrogen). See class stellar site for protocol. Oh & Yamaguchi, unpublished lab report
- ↑ 2.0 2.1 Hooke, R. Micrographia: or Some Physiological Descriptions of Minute Bodies made by Magnifying Glasses with Observations and Inquiries Thereupon London:Jo. Martyn, and Ja. Allestry, Printers to the Royal Society; 1665
- ↑ http://www.historycommons.org/context.jsp?item=a043074editedtranscripts
- ↑ Fall 2007
- ↑ See, for example: McClintock, B. The origin and behavior of mutable loci in maize. PNAS. 1950; 36:344-355. [1], [2], and Endersby, Jim. A Guinea Pig's History of Biology. Cambridge, Massachusetts: Harvard University Press; 2007.
- ↑ 6.0 6.1 taken from http://labs.physics.berkeley.edu/mediawiki/index.php/Brownian_Motion_in_Cells
- ↑ A. Einstein, On the Motion of Small Particles Suspended in Liquids at Rest Required by the Molecular-Kinetic Theory of Heat, Annalen der Physik (1905).
- ↑ E. Frey and K. Kroy, Brownian motion: a paradigm of soft matter and biological physics, Ann. Phys. (2005). Published on the 100th anniversary of Einstein’s paper, this reference chronicles the history of Brownian motion from 1905 to the present.
- ↑ R. Newburgh, Einstein, Perrin, and the reality of atoms: 1905 revisited, Am. J. Phys. (2006). A modern replication of Perrin's experiment. Has a good, concise appendix with both the Einstein and Langevin derivations.
- ↑ M. Haw, Colloidal suspensions, Brownian motion, molecular reality: a short history, J. Phys. Condens. Matter (2002).

