Difference between revisions of "20.109(S20):Characterize clone by titration using flow cytometry (Day4)"
(→Part 1: Align scFv sequences) |
(→Introduction) |
||
| (45 intermediate revisions by 2 users not shown) | |||
| Line 4: | Line 4: | ||
==Introduction== | ==Introduction== | ||
| + | The goal of this module is to find a scFv clone with increased stability and affinity for our antigen lysozyme. Today we will carry out a quantitative binding experiment to measure the binding affinity via flow cytometry. Binding affinity is usually measured and reported as an equilibrium dissociation constant , denoted Kd. We will measure binding with a similar approach as our initial library screen. In our initial screen we had many different yeast clones(~10 million) expressing scFvs, and we incubated these yeast with one concentration of lysozyme. Today to calculate the equilibrium dissociation constant we will titrate a single scFv clone with varying concentrations of lysozyme. As we did on M3D1 we will use AlexaFluor488(green) labeled antibodies to mark the scFv on the surface of our yeast clone and AlexaFluor647(far red) labeled streptavidin to mark the presence of bound biotinylated lysozyme as seen in Figure 1. [[Image:Sp20 scFvLigandDisplay.jpg|thumb|right|250px|Schematic of scFv yeast surface display bound to ligand, lysozyme.]] | ||
| + | |||
| + | To accurately measure the binding affinity of your clone you will measure eight concentration of ligand, biotinylated lysozyme, with the same number of yeast expressing one clone. The concentration range should ideally span two orders of magnitude both above and below the estimated Kd of the clone being measured, but practical considerations of tube volumes or reagent usage may limit the ability to achieve this goal. The amount of time you incubate the ligand and scFV should be considered as we are measuring binding at equilibrium. Practically for most antibody-antigen interactions 30minutes is sufficient and one to two hours is common practice. After equilibrium binding is met the lysozyme/yeast mix should be kept on ice to minimize antigen dissociation. | ||
| + | |||
| + | To set up our flow cytometry protocol we will also need to prepare control samples for each clone prior to analysis. We will prepare two negative control samples, the first is the yeast clone with no fluorophores or ligand added, and the second is secondary only with no primary antibody. Next two positive controls, one with primary anti-c-myc antibody and AlexaFluor488 labeled secondary antibodies only. The second positive control should include biotinylated lysozyme at a concentration known to bind your clone, concentration of lysozyme used in the initial screen, and AlexaFluor647 labeled streptavidin only. | ||
| + | |||
| + | All prepared samples will be transported on ice to the Accuri C6 flow cytometer in the Lauffenburger lab. To start the analysis, the negative control yeast population is gated on forward- and side-scatter channels to remove debris and aggregated cells and establish background fluorescence from fluorophores non specifically sticking to the yeast. Then the positive control samples should be used to establish the fluorescent signal from a single color. Prior to our experiment we can use the BD Bioscience spectrum viewer to check the excitation and emission profiles of our fluorophores of choice on the analyzer we are using for our experiment. The figures below show the result of the excitation and emission of AlexaFluor488 (left) and AlexaFluor647 (right) on the Accuri C6 flow cytometer. Do you predict we will have significant signal strength on the Accuri C6 with our fluorophores of choice? | ||
| + | <br>[[Image:Accuri Ex488Chart.png|left|thumb|350px|BD Bioscience spectrum viewer for AlexFluor 488 on Accuri C6]] | ||
| + | [[Image:Accuri Ex647Chart.png|center|thumb|350px|BD Bioscience spectrum viewer for AlexFluor 647 on Accuri C6]] | ||
| + | |||
| + | <br>In parallel with our scFv titration, we need to run our negative and single-color positive controls. In FACS (i.e. sorting), these help us adjust the voltage thresholds and draw our sorting gates to make sure we sort the correct cells. With the Accuri C5 flow cytometer, we cannot adjust the voltages and thus, the controls are only used in post-processing when analyzing our titration. We will also perform the flow cytometry and analyze the titration of lysozyme to the original scFv clone which has reported equilibrium dissociation constant of 650nM. Do you think your clone's Kd will be higher or lower? | ||
==Protocols== | ==Protocols== | ||
| − | + | Today, you will be analyzing the scFv clone that you selected via sequence alignment during our last laboratory session for binding to lysozyme. Your goal for today is to complete Part 1 of the protocol with one hour to spare at the end of this session. At this point, we will all walk over to the flow cytometer to begin analyzing our scFvs. | |
| − | Your goal for | + | |
| − | + | === Part 1: Prepare Titration Lysozyme with scFv Clone on Yeast === | |
| + | Prior to this session, the instructors transformed your chosen sequence back into yeast and grew up transformed colonies on SDCAA selective plates. Next, they picked an individual colony to grow up in SDCAA media culture. After a day of growth, the culture was passaged (i.e. spun down and resuspended) into SGCAA media to induce expression of your scFv on the surface of the yeast. | ||
| − | + | '''Retrieve yeast culture labelled with your groups color from 20°C incubator''' | |
| − | + | ||
| − | + | ||
| − | + | ||
| − | + | ||
| − | + | ||
| − | + | ||
| − | + | ||
| − | + | ||
| − | + | #Measure the optical density (OD) of your yeast on the spectrophotometer. | |
| + | #*Blank the spectrophotometer with >1000 uL of SGCAA media in a clear cuvette | ||
| + | #*Add 900 uL of SGCAA media to a new cuvette. Add 100 uL of your yeast culture and mix well by pipetting up and down. | ||
| + | #*Record the OD(@600nm) of your sample by taking a measurement using the spectrophotometer and multiplying by 10 (to account for the 10x dilution). | ||
| + | #Determine how many microliters of your sample are required to analyze 1x10<sup>6</sup> yeast cells. | ||
| + | #*The conversion rate from OD to cells for yeast is: (10<sup>7</sup> yeast cells)/(OD x mL of culture) | ||
| + | #*Thus, An optical density of 1 at 600nm equals 10<sup>7</sup> yeast cells per mL. | ||
| + | #Add 10 microcentrifuge tubes to your rack and label them 1-10 with tape matching your team’s color. | ||
| + | #Add the correct volume of culture (calculated above) such that 10^6 yeast are added to each tube. | ||
| + | #Add an additional 900 uL of PBSA to each centrifuge tube and pellet the cells for 2 minutes in microcentrifuge at 4000xg. | ||
| + | #Discard supernatant carefully with vacuum aspirator or with pipette (Do not touch or disturb the yeast pellet!). Wash with an additional 1 mL of PBSA, pellet, and remove supernatant. Repeat washing step once more. | ||
| − | + | '''Retrieve biotinylated lysozyme stock solution from instructors''' | |
| − | + | ||
| − | + | ||
| − | + | ||
| − | + | ||
| − | + | ||
| − | + | ||
| − | + | ||
| − | + | ||
| − | + | ||
| − | + | ||
| − | + | ||
| − | + | ||
| − | + | #Use additional microcentrifuge tubes to prepare dilutions of lysozyme stock solution in PBSA | |
| − | + | #*Start by making a 2000 uL volume sample of 1000 nM biotinylated lysozyme. Then, calculate and prepare dilutions from that sample in additional microcentrifuge tubes (starting with 1500 uL of 316 nM solution, then 1500 uL of 100 nM solution, etc.) | |
| + | #Add 1000 uL of correct concentration of lyzosyme solution to each labeled sample tube as directed below (Tubes 1-8). Carefully, resuspend the pelleted yeast. Add 1000 uL of PBSA (no lysozyme) to Tubes 9 and 10. | ||
| + | #*Tube 1 = 1000 nM biotinylated lysozyme + 10<sup>6</sup> displaying yeast cells | ||
| + | #*Tube 2 = 316 nM biotinylated lysozyme + 10<sup>6</sup> displaying yeast cells | ||
| + | #*Tube 3 = 100 nM biotinylated lysozyme + 10<sup>6</sup> displaying yeast cells | ||
| + | #*Tube 4 = 31.6 nM biotinylated lysozyme + 10<sup>6</sup> displaying yeast cells | ||
| + | #*Tube 5 = 10 nM biotinylated lysozyme + 10<sup>6</sup> displaying yeast cells | ||
| + | #*Tube 6 = 3.16 nM biotinylated lysozyme + 10<sup>6</sup> displaying yeast cells | ||
| + | #*Tube 7 = 1 nM biotinylated lysozyme + 10<sup>6</sup> displaying yeast cells | ||
| + | #*Tube 8 = 0.1 nM biotinylated lysozyme + 10<sup>6</sup> displaying yeast cells | ||
| + | #*Tube 9 = 10<sup>6</sup> displaying yeast cells (secondary staining only) (no lysozyme) | ||
| + | #*Tube 10 = 10<sup>6</sup> displaying yeast cells (no staining) (no lysozyme) | ||
| + | #Add '''primary staining''' to samples: Add 1 uL of the chicken antibody specific for the c-myc tag (GaCmyc mAb) to Tubes 1-8 | ||
| + | #Incubate samples on nutator at 4°C for 30-60 minutes. | ||
| + | #After incubation, pellet cells at 4000xg for 2 minutes. Discard supernatant carefully with vacuum aspirator or with pipette (Do not touch or disturb the yeast pellet!). Wash with an additional 1 mL of PBSA, pellet, remove supernatant, and resuspend with 1 mL of PBSA. | ||
| + | #Add '''secondary staining''' to samples: Add 1 uL of goat polyclonal antibody mix labelled with Alexa Fluor 488 specific for chicken antibodies (GaC488) and 1 uL of streptavidin labelled with Alexa Fluor 647 (SAV647) to Tubes 1-9. | ||
| + | #Incubate samples on nutator at room temperature for 20-30 minutes. | ||
| + | #After incubation, pellet cells at 4000xg for 2 minutes. Discard supernatant carefully with vacuum aspirator or with pipette (Do not touch or disturb the yeast pellet!). Wash with an additional 1 mL of PBSA, pellet, remove supernatant, and resuspend with 1 mL of PBSA. | ||
| + | #Place samples on ice and give them to the instructors. | ||
| + | === Part 2: Accuri Flow Cytometry of Stained Yeast Samples === | ||
| + | At this point, we will watch as one of the instructors prepares the flow cytometer to analyze our stained samples. The machine needs to be flushed with shealth fluid to remove any contamination from previous samples. Your samples will then be filtered one by one into round bottom analyzer tubes and placed under the cytometer sip. The machine will then suck up the sample, and produce the characteristic flow dot plots. The Accuri will record the data from each laser and filter for every cell. The gating that the instructor performs will simply help visualize the samples as we perform the experiment but all the data will be saved automatically for post-processing analysis. For more details on flow cytometry please see the introduction above and the [[20.109(S20):Enrich candidate clones using fluorescence-activated cell sorter (FACS) (Day1)|introduction to M3D1 ]]. | ||
| − | + | ==Reagents list== | |
| + | *SDCAA (Minimal yeast media composed of salts, Difco yeast nitrogen base, dextrose, and casmino acids) | ||
| + | *SGCAA (Minimal yeast media composed of salts, Difco yeast nitrogen base, galactose, and casmino acids) | ||
| + | *PBSA (Phosphate-buffered-saline solution with 0.1% w/v Albumin) | ||
| + | *Biotinylated lysozyme stock solution (prepared by instructors, Sigma Aldrich) | ||
| + | '''Primary Staining Reagents: ''' | ||
| + | *Chicken anti-cMyc Ab (1:1000, Gallus) | ||
| + | '''Secondary Staining Reagents: ''' | ||
| + | *Streptavidin AlexaFluor 488 conjugate (1:1000, Life Technologies) | ||
| + | *Goat anti-chicken AlexaFluor647 Ab (1:1000, Life Technologies). | ||
| − | + | ==Navigation links== | |
Next day: [[20.109(S20):Analyze titration curves (Day5) |Analyze titration curves ]]<br> | Next day: [[20.109(S20):Analyze titration curves (Day5) |Analyze titration curves ]]<br> | ||
Previous day: [[20.109(S20):Identify clones to characterize (Day3) |Identify clones to characterize]]<br> | Previous day: [[20.109(S20):Identify clones to characterize (Day3) |Identify clones to characterize]]<br> | ||
Latest revision as of 19:11, 20 April 2020
Contents
Introduction
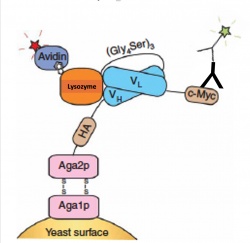
The goal of this module is to find a scFv clone with increased stability and affinity for our antigen lysozyme. Today we will carry out a quantitative binding experiment to measure the binding affinity via flow cytometry. Binding affinity is usually measured and reported as an equilibrium dissociation constant , denoted Kd. We will measure binding with a similar approach as our initial library screen. In our initial screen we had many different yeast clones(~10 million) expressing scFvs, and we incubated these yeast with one concentration of lysozyme. Today to calculate the equilibrium dissociation constant we will titrate a single scFv clone with varying concentrations of lysozyme. As we did on M3D1 we will use AlexaFluor488(green) labeled antibodies to mark the scFv on the surface of our yeast clone and AlexaFluor647(far red) labeled streptavidin to mark the presence of bound biotinylated lysozyme as seen in Figure 1.To accurately measure the binding affinity of your clone you will measure eight concentration of ligand, biotinylated lysozyme, with the same number of yeast expressing one clone. The concentration range should ideally span two orders of magnitude both above and below the estimated Kd of the clone being measured, but practical considerations of tube volumes or reagent usage may limit the ability to achieve this goal. The amount of time you incubate the ligand and scFV should be considered as we are measuring binding at equilibrium. Practically for most antibody-antigen interactions 30minutes is sufficient and one to two hours is common practice. After equilibrium binding is met the lysozyme/yeast mix should be kept on ice to minimize antigen dissociation.
To set up our flow cytometry protocol we will also need to prepare control samples for each clone prior to analysis. We will prepare two negative control samples, the first is the yeast clone with no fluorophores or ligand added, and the second is secondary only with no primary antibody. Next two positive controls, one with primary anti-c-myc antibody and AlexaFluor488 labeled secondary antibodies only. The second positive control should include biotinylated lysozyme at a concentration known to bind your clone, concentration of lysozyme used in the initial screen, and AlexaFluor647 labeled streptavidin only.
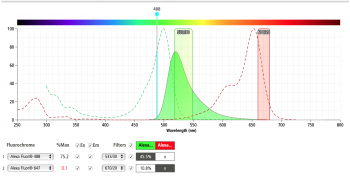
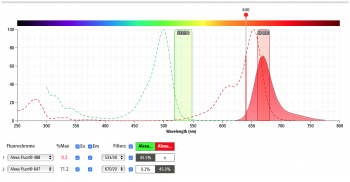
All prepared samples will be transported on ice to the Accuri C6 flow cytometer in the Lauffenburger lab. To start the analysis, the negative control yeast population is gated on forward- and side-scatter channels to remove debris and aggregated cells and establish background fluorescence from fluorophores non specifically sticking to the yeast. Then the positive control samples should be used to establish the fluorescent signal from a single color. Prior to our experiment we can use the BD Bioscience spectrum viewer to check the excitation and emission profiles of our fluorophores of choice on the analyzer we are using for our experiment. The figures below show the result of the excitation and emission of AlexaFluor488 (left) and AlexaFluor647 (right) on the Accuri C6 flow cytometer. Do you predict we will have significant signal strength on the Accuri C6 with our fluorophores of choice?
In parallel with our scFv titration, we need to run our negative and single-color positive controls. In FACS (i.e. sorting), these help us adjust the voltage thresholds and draw our sorting gates to make sure we sort the correct cells. With the Accuri C5 flow cytometer, we cannot adjust the voltages and thus, the controls are only used in post-processing when analyzing our titration. We will also perform the flow cytometry and analyze the titration of lysozyme to the original scFv clone which has reported equilibrium dissociation constant of 650nM. Do you think your clone's Kd will be higher or lower?
Protocols
Today, you will be analyzing the scFv clone that you selected via sequence alignment during our last laboratory session for binding to lysozyme. Your goal for today is to complete Part 1 of the protocol with one hour to spare at the end of this session. At this point, we will all walk over to the flow cytometer to begin analyzing our scFvs.
Part 1: Prepare Titration Lysozyme with scFv Clone on Yeast
Prior to this session, the instructors transformed your chosen sequence back into yeast and grew up transformed colonies on SDCAA selective plates. Next, they picked an individual colony to grow up in SDCAA media culture. After a day of growth, the culture was passaged (i.e. spun down and resuspended) into SGCAA media to induce expression of your scFv on the surface of the yeast.
Retrieve yeast culture labelled with your groups color from 20°C incubator
- Measure the optical density (OD) of your yeast on the spectrophotometer.
- Blank the spectrophotometer with >1000 uL of SGCAA media in a clear cuvette
- Add 900 uL of SGCAA media to a new cuvette. Add 100 uL of your yeast culture and mix well by pipetting up and down.
- Record the OD(@600nm) of your sample by taking a measurement using the spectrophotometer and multiplying by 10 (to account for the 10x dilution).
- Determine how many microliters of your sample are required to analyze 1x10⁶ yeast cells.
- The conversion rate from OD to cells for yeast is: (107 yeast cells)/(OD x mL of culture)
- Thus, An optical density of 1 at 600nm equals 107 yeast cells per mL.
- Add 10 microcentrifuge tubes to your rack and label them 1-10 with tape matching your team’s color.
- Add the correct volume of culture (calculated above) such that 10^6 yeast are added to each tube.
- Add an additional 900 uL of PBSA to each centrifuge tube and pellet the cells for 2 minutes in microcentrifuge at 4000xg.
- Discard supernatant carefully with vacuum aspirator or with pipette (Do not touch or disturb the yeast pellet!). Wash with an additional 1 mL of PBSA, pellet, and remove supernatant. Repeat washing step once more.
Retrieve biotinylated lysozyme stock solution from instructors
- Use additional microcentrifuge tubes to prepare dilutions of lysozyme stock solution in PBSA
- Start by making a 2000 uL volume sample of 1000 nM biotinylated lysozyme. Then, calculate and prepare dilutions from that sample in additional microcentrifuge tubes (starting with 1500 uL of 316 nM solution, then 1500 uL of 100 nM solution, etc.)
- Add 1000 uL of correct concentration of lyzosyme solution to each labeled sample tube as directed below (Tubes 1-8). Carefully, resuspend the pelleted yeast. Add 1000 uL of PBSA (no lysozyme) to Tubes 9 and 10.
- Tube 1 = 1000 nM biotinylated lysozyme + 106 displaying yeast cells
- Tube 2 = 316 nM biotinylated lysozyme + 106 displaying yeast cells
- Tube 3 = 100 nM biotinylated lysozyme + 106 displaying yeast cells
- Tube 4 = 31.6 nM biotinylated lysozyme + 106 displaying yeast cells
- Tube 5 = 10 nM biotinylated lysozyme + 106 displaying yeast cells
- Tube 6 = 3.16 nM biotinylated lysozyme + 106 displaying yeast cells
- Tube 7 = 1 nM biotinylated lysozyme + 106 displaying yeast cells
- Tube 8 = 0.1 nM biotinylated lysozyme + 106 displaying yeast cells
- Tube 9 = 106 displaying yeast cells (secondary staining only) (no lysozyme)
- Tube 10 = 106 displaying yeast cells (no staining) (no lysozyme)
- Add primary staining to samples: Add 1 uL of the chicken antibody specific for the c-myc tag (GaCmyc mAb) to Tubes 1-8
- Incubate samples on nutator at 4°C for 30-60 minutes.
- After incubation, pellet cells at 4000xg for 2 minutes. Discard supernatant carefully with vacuum aspirator or with pipette (Do not touch or disturb the yeast pellet!). Wash with an additional 1 mL of PBSA, pellet, remove supernatant, and resuspend with 1 mL of PBSA.
- Add secondary staining to samples: Add 1 uL of goat polyclonal antibody mix labelled with Alexa Fluor 488 specific for chicken antibodies (GaC488) and 1 uL of streptavidin labelled with Alexa Fluor 647 (SAV647) to Tubes 1-9.
- Incubate samples on nutator at room temperature for 20-30 minutes.
- After incubation, pellet cells at 4000xg for 2 minutes. Discard supernatant carefully with vacuum aspirator or with pipette (Do not touch or disturb the yeast pellet!). Wash with an additional 1 mL of PBSA, pellet, remove supernatant, and resuspend with 1 mL of PBSA.
- Place samples on ice and give them to the instructors.
Part 2: Accuri Flow Cytometry of Stained Yeast Samples
At this point, we will watch as one of the instructors prepares the flow cytometer to analyze our stained samples. The machine needs to be flushed with shealth fluid to remove any contamination from previous samples. Your samples will then be filtered one by one into round bottom analyzer tubes and placed under the cytometer sip. The machine will then suck up the sample, and produce the characteristic flow dot plots. The Accuri will record the data from each laser and filter for every cell. The gating that the instructor performs will simply help visualize the samples as we perform the experiment but all the data will be saved automatically for post-processing analysis. For more details on flow cytometry please see the introduction above and the introduction to M3D1 .
Reagents list
- SDCAA (Minimal yeast media composed of salts, Difco yeast nitrogen base, dextrose, and casmino acids)
- SGCAA (Minimal yeast media composed of salts, Difco yeast nitrogen base, galactose, and casmino acids)
- PBSA (Phosphate-buffered-saline solution with 0.1% w/v Albumin)
- Biotinylated lysozyme stock solution (prepared by instructors, Sigma Aldrich)
Primary Staining Reagents:
- Chicken anti-cMyc Ab (1:1000, Gallus)
Secondary Staining Reagents:
- Streptavidin AlexaFluor 488 conjugate (1:1000, Life Technologies)
- Goat anti-chicken AlexaFluor647 Ab (1:1000, Life Technologies).
Next day: Analyze titration curves


