Difference between revisions of "20.109(S07): Measuring calcium in vivo"
| Line 12: | Line 12: | ||
#visualize cells vs controls | #visualize cells vs controls | ||
#modulate Ca++ with ionophores/chelators | #modulate Ca++ with ionophores/chelators | ||
| + | Before you leave lab today, please upload at least on image to the discussion page associated with today's lab. Include a description of the image, written as though you are submitting a figure for a journal article. You should include a title for the image (often the conclusion you would like the reader to draw) and some information about the image for readers who know nothing about the experiment you've performed (cell type, magnification, intent of the experiment, conclusion you can draw). Be sure to include your names or team color as well. | ||
| + | |||
DONE! | DONE! | ||
==For next time== | ==For next time== | ||
==Reagents list== | ==Reagents list== | ||
Revision as of 12:20, 28 December 2006
Introduction
Microscopy can reveal aspects of cellular structures that other techniques cannot address. Information about a cell's shape, its cellular compartments and the components of those compartments are all routinely collected thanks to laboratory microscopes no different than the one you'll use today. Furthermore, as research to improve microscopy techniques continues, breakthroughs are reported that improve digital image analysis and that increase detection limits imposed by light's diffraction , for example the recent description of PALM microscopy.
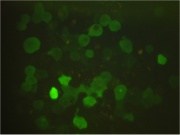
Consider the image that appears on the front cover of this experimental module.
Once could qualitatively describe the appearance of the cells under the fluorescent microscope ("a mixture of non-fluorescent and fluorescent cells, some more brightly fluorescent than others"). A more quantitative measurement of the fluorescence associated with each cell might be gleened from sorting the cells using flow cytometry. With that technique, the spectral signature of individual cells can be assessed, at an astonishing rate (hundreds of thousands of cells/minute), and the population can be "binned" according to the brightness of their signal. But lost is information regarding localization of the signal inside each cell, and real time changes in fluorescence of single cells cannot be assessed with this technique.
Protocols
Microscopy
- visualize cells vs controls
- modulate Ca++ with ionophores/chelators
Before you leave lab today, please upload at least on image to the discussion page associated with today's lab. Include a description of the image, written as though you are submitting a figure for a journal article. You should include a title for the image (often the conclusion you would like the reader to draw) and some information about the image for readers who know nothing about the experiment you've performed (cell type, magnification, intent of the experiment, conclusion you can draw). Be sure to include your names or team color as well.
DONE!

